. 2025 Apr 30;23(1):209.
doi: 10.1186/s12964-025-02208-w.

Endoplasmic reticulum stress disrupts signaling via altered processing of transmembrane receptors

Affiliations

Endoplasmic reticulum stress disrupts signaling via altered processing of transmembrane receptors

Michaela Bosakova et al. Cell Commun Signal. .

Abstract

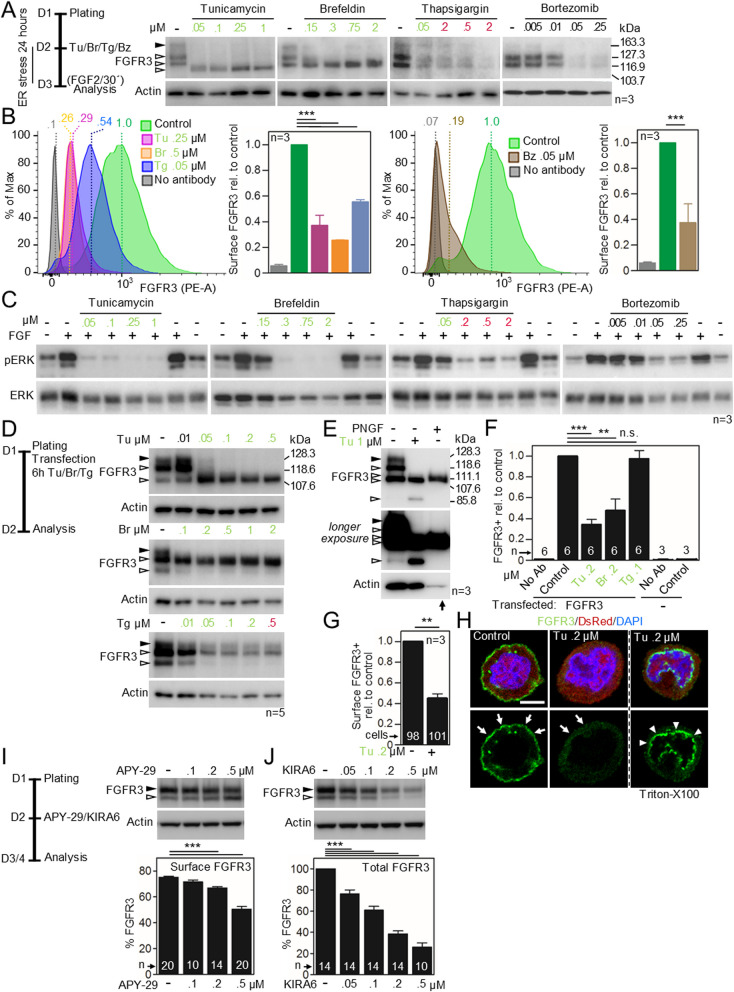
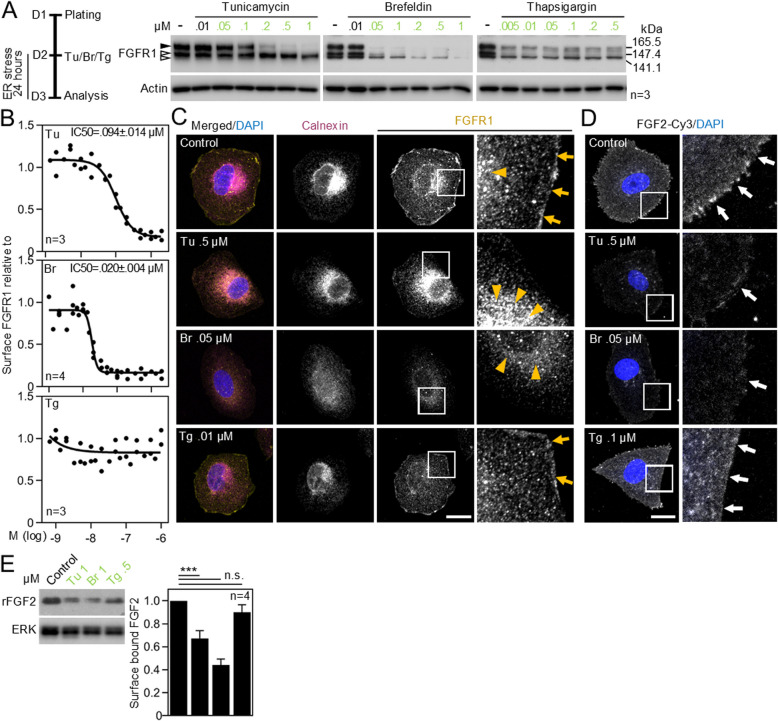
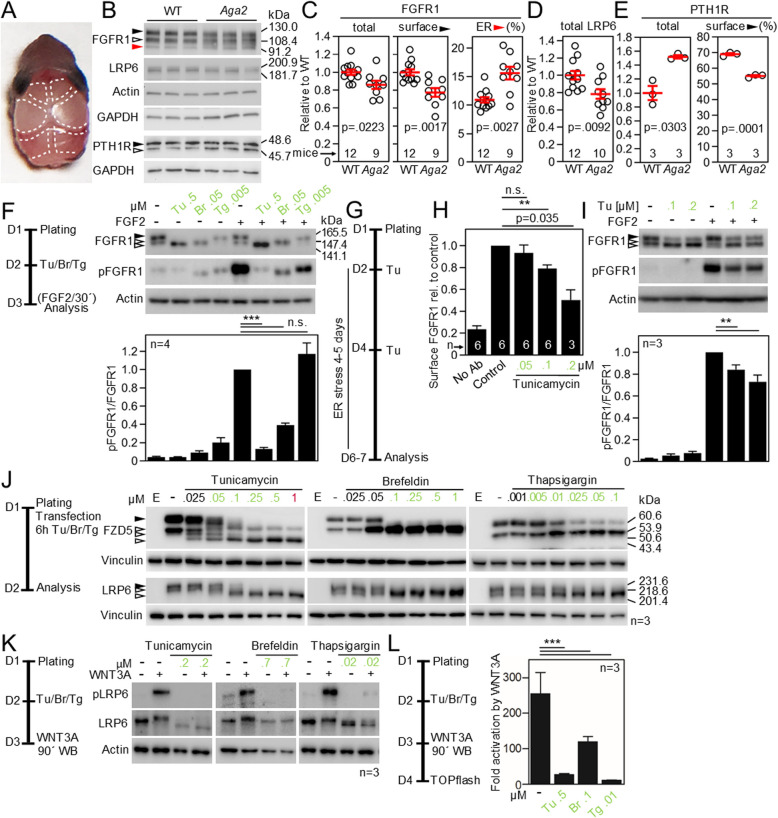
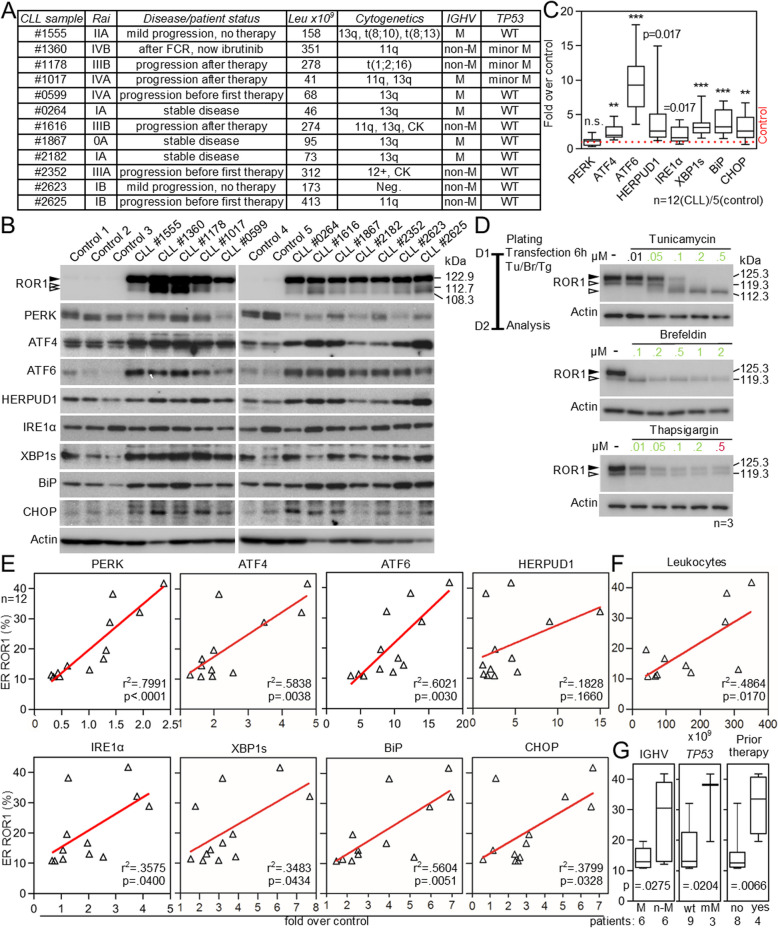
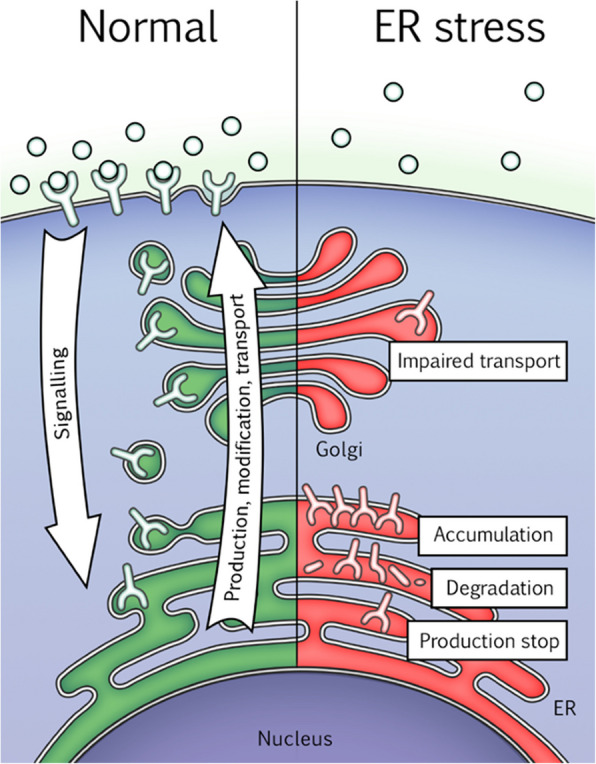
Cell communication systems based on polypeptide ligands use transmembrane receptors to transmit signals across the plasma membrane. In their biogenesis, receptors depend on the endoplasmic reticulum (ER)-Golgi system for folding, maturation, transport and localization to the cell surface. ER stress, caused by protein overproduction and misfolding, is a well-known pathology in neurodegeneration, cancer and numerous other diseases. How ER stress affects cell communication via transmembrane receptors is largely unknown. In disease models of multiple myeloma, chronic lymphocytic leukemia and osteogenesis imperfecta, we show that ER stress leads to loss of the mature transmembrane receptors FGFR3, ROR1, FGFR1, LRP6, FZD5 and PTH1R at the cell surface, resulting in impaired downstream signaling. This is caused by downregulation of receptor production and increased intracellular retention of immature receptor forms. Reduction of ER stress by treatment of cells with the chemical chaperone tauroursodeoxycholic acid or by expression of the chaperone protein BiP resulted in restoration of receptor maturation and signaling. We show a previously unappreciated pathological effect of ER stress; impaired cellular communication due to altered receptor processing. Our findings have implications for disease mechanisms related to ER stress and are particularly important when receptor-based pharmacological approaches are used for treatment.

Keywords: ER; Endoplasmic reticulum; Impaired; Receptor; Signaling; Stress; Transmembrane.


Conflict of interest statement

Declarations. Competing interests: The authors declare no competing interests.

Figures

Fig. 1
Fig. 1
ER stress impairs FGFR3 maturation and signaling in multiple myeloma cells. A Expression of endogenous FGFR3 in KMS11 cells treated with tunicamycin (Tu), brefeldin (Br), thapsigargin (Tg), and bortezomib (Bz), determined by FGFR3 western blot (black arrowhead, mature FGFR3 at the cell surface; open arrowheads, immature FGFR3). Actin served as a loading control. Black, no ER stress; green, non-toxic ER stress; red, toxic ER stress (not determined for Bz). B Surface expression of FGFR3 in KMS11 cells, determined by flow-cytometry with FGFR3-PE antibody on live cells. The median intensity values were obtained and normalized to non-treated control. C The ERK MAP kinase phosphorylation (p) in KMS11 cells treated with 25–40 ng/ml FGF2 for 30 min. D 293T cells were transfected with human FGFR3, and treated with Tu, Br and Tg for 24 h to induce ER stress. E The molecular weight of mature FGFR3 is 128·3 kDa, due to glycosylation of immature, 107·6 kDa FGFR3, as evidenced in 293T cell lysates treated with N-glycosidase F (PNGase F). An additional FGFR3 variant (85·8 kDa), corresponding to 853 amino acids of transgenic FGFR3 is observed after longer exposition of the blot. PNGase F-treated cell lysates were diluted to obtain FGFR3 amounts similar to cells treated with 1 µM Tu (actin blot, arrow). F Analyses of cell-surface expression of transfected FGFR3 in live 293T cells by flow-cytometry; data were expressed as the relative amount of cell-surface FGFR3 positive cells. G, H Cell-surface expression of transfected FGFR3 by immunocytochemistry on fixed, non-permeabilized RCS cells (left two panels), or cells permeabilized by Triton-X100 (dashed line, right panel). The graph shows the relative amounts of cells with surface FGFR3 signal. Note the intracellular retention of FGFR3 in RCS cells treated with Tu (arrowheads, versus arrows for cell surface FGFR3). DsRed co-transfection was used to track the FGFR3-transfected cells. I, J 293T-FGFR3 cells were treated with APY-29 (agonist of the IRE1α endonuclease activity) or KIRA6 (inhibitor of IRE1α kinase activity), and analyzed for FGFR3 expression by western blot. Statistical significances were calculated using Student´s t-test (p < 0·05; ** p < 0·01, *** p < 0·001); n.s. – not significant. Bar plots – mean ± S.E. n, number of independent experiments
Fig. 2
Fig. 2
ER stress and FGFR1 maturation. A Short-term ER stress experiments with U2OS-FGFR1 cells. Cells were treated with tunicamycin (Tu), brefeldin (Br) or thapsigargin (Tg) for 24 h (black, no ER stress; green, survivable ER stress; survival data in Fig. S10A-C). FGFR1 expression was analyzed by western blot (black arrowhead, mature FGFR1 at the cell surface; open arrowheads, immature FGFR1). B Cell surface FGFR1, determined by flow-cytometry on live cells. IC50 (mean ± S.E.) was calculated for Tu and Br; no changes in surface FGFR1 were found in cells treated with Tg. C Subcellular localization of FGFR1; calnexin immunolabeling indicates the ER. Note the absence of cell-surface FGFR1 (arrows) and its accumulation in ER (arrowheads) of cells treated with Tu and Br (scale bar, 10 µm). D Cells were treated with Cy3-labelled FGFR1 ligand FGF2, and the cell surface-bound Cy3-FGF2 was visualized by confocal microscopy (arrows). (E) Cells were treated with recombinant FGF2 (rFGF2), and the cells surface-associated rFGF2 was determined by western blot. FGF2 signal was normalized to ERK expression, and plotted. Statistical significances were calculated using Student´s t-test (p<005; **p<0·01, ***p<0·001); n.s. – not significant. Bar plot – mean ± S.E. n, number of independent experiments
Fig. 3
Fig. 3
ER stress impairs FGFR1, LRP6 and PTH1R maturation in osteogenesis imperfecta. A The postnatal day 4 (P4) mouse skull with indicated calvarias used for sample collection. B Calvaria lysates of P4 wildtype (WT) and Aga2 (OI) mice were immunoblotted for FGFR1, LRP6 and PTH1R; actin and GAPDH served as loading controls. Black arrowhead, mature FGFR1 or PTH1R at the cell surface; open and red arrowheads, immature FGFR1 or PTH1R variants. C Total, cell surface (black arrow) and ER (red arrow) FGFR1 signal was quantified by densitometry, normalized to actin or GAPDH (Fig. S11) and presented as values relative to an average WT. D Total LRP6 expression was downregulated in Aga2 mice. E Total PTH1R expression was upregulated, and the portion of cell surface (black arrow) PTH1R was downregulated in Aga2 mice. F U2OS-FGFR1 cells were treated with tunicamycin (Tu), brefeldin (Br) or thapsigargin (Tg) for 24 h, stimulated with 100 ng/ml FGF2 for 30 min, and analyzed for FGFR1 phosphorylation (p) by western blot; total FGFR1 levels and actin served as loading controls. pFGFR1 signal was normalized to total FGFR1, and plotted. G Chronic ER stress experiments. Cells were treated with Tu for 4–5 days, and analyzed (survival data in Fig. S10D-F). H Cell surface FGFR1 expression in cells treated with Tu, determined by flow-cytometry (no Ab, no FGFR1 antibody). I Cells were treated with Tu for 4–5 days before treatment with 100 ng/ml FGF2 for 30 min. pFGFR1 signal was normalized to total FGFR1, and plotted. J 293T cells were transfected with plasmids expressing FZD5 and LRP6 receptors, and treated with Tu, Br and Tg for 24 h (black, no ER stress; green, non-toxic ER stress; red, toxic ER stress). Cells were analyzed for expression of given proteins by western blot (black arrowhead, mature receptor at the cell surface; open arrowheads, immature receptor isoforms). K SAOS2 cells (Fig. S12) were treated with indicated concentrations of Tu, Br and Tg for 24 h, stimulated with WNT3A for 90 min, and immunoblotted for LRP6 phosphorylated (p) at Ser1490. L 293T-STF cells were treated with Tu, Br and Tg, and WNT3A. The levels of TOPflash transactivation (fold activation by WNT3A relative to control) were graphed. Statistical significances were calculated using Student´s t-test (p < 0·05; ** p < 0·01, *** p < 0·001); n.s. – not significant. Bar plots – mean ± S.E. Scatter plots – individual animals (open circles) and mean ± S.E. n, number of independent experiments
Fig. 4
Fig. 4
ER stress impairs ROR1 maturation in chronic lymphoid leukemia. A CLL patient status at the time when the peripheral blood biopsy was taken. Leu, the number of leukocytes per liter. FCR, Fludarabine, cyclophosphamide and rituximab; M, mutated IGHV. Minor M/mM, mutation detected in TP53 present with less than 5% variant allele frequency; CK, complex karyotype; Neg., negative. B B cells purified from CLL patients and healthy controls were analyzed by western blot for the expression and migration pattern of ROR1 and for the UPR markers PERK, ATF4, ATF6, HERPUD1, IRE1α, XBP1s, BiP and CHOP; actin was used as a loading control. Note the various degree of ER accumulation of ROR1 (black arrowhead, mature receptor at the cell surface; open arrowheads, immature receptor in the ER), and of ER stress among the CLL patients. C The UPR marker expression was analyzed by densitometry, normalized to actin and plotted as a ratio to an average healthy control (red dashed line). D 293T cells were transfected with C-terminally V5-tagged human ROR1 and treated with tunicamycin, brefeldin and thapsigargin for 24 h (black, no ER stress; green, non-toxic ER stress; red, toxic ER stress). Cells were analyzed for ROR1 expression by western blot (black arrowhead, mature ROR1 at the cell surface; open arrowheads, immature ROR1). E The ER ROR1 levels correlate with ER stress levels in CLL. The percentage of ER ROR1 in the 12 analyzed CLL patients was plotted against UPR expression levels. F The ER ROR1 levels correlate with leukocyte counts in the peripheral blood of individuals with CLL. G The ER ROR1 levels correlate with the IGHV and TP53 mutation status, and the prior therapy. Statistical significances were calculated using Student´s t-test (p < 0·05; ** p < 0·01, *** p < 0·001); n.s. – not significant. Bar plots – mean ± S.E. Box and whiskers – min–max 10–90%. Scatter plots – individual patients (open triangles) and linear regression (red line and the r2 and p values). n, number of individuals or independent experiments
Fig. 5
Fig. 5
BiP and TUDCA restore cell surface receptor levels and signaling during ER stress. A Phosphorylation (p) of ERK MAP kinase in RCS cells treated by FGFR3 ligand FGF2. Vinculin and total ERK serve as loading controls. Relative pERK levels were determined and plotted on the right. B FGF2-mediated activation of FGFR3 signaling RCS cells, determined by transactivation of pKrox24 transcriptional reporter coupled with firefly luciferase; data were expressed as fold induction relative to untreated control. C Inhibition of FGF2-mediated pKrox24 transactivation by Tu was partially rescued by treatment with the thermally stable (S) variant of FGF2. D 293T cells were co-transfected with FGFR3 and BiP-Flag, treated with tunicamycin (Tu), and analyzed by western blot 24 h later. Percentage of ER (red arrowhead) and surface (black arrowhead) FGFR3 was obtained by densitometry and plotted. E, F RCS-FGFR3-G380R::pKrox24-DsRed cells were treated with FGF2, and the DsRed induction was monitored by western blot (E) or live cell imaging (F; scale bar 50 µm). G Cells were treated with Tu and TUDCA, and analyzed by western blot 48 h later (H), or treated with FGF2 and monitored by automated microscopy for additional 24 h (I). H TUDCA restored Tu-induced loss of surface FGFR3 (black arrowhead, mature FGFR3 at the cell surface; open arrowheads, immature FGFR3 variants). HERPUD1 was used to monitor ER stress, vinculin served as loading control (signal quantifications at Fig. S15B). I TUDCA restored Tu-induced loss of FGF2-mediated pKrox24-DsRed transactivation, monitored by live cell imaging. J U2OS-FGFR1 cells were treated with Tu and TUDCA for 48 h, and the surface levels of FGFR1 and its signaling were monitored by flow-cytometry (K) and western blot (L). K TUDCA restored Tu-mediated loss of surface FGFR1. Note the increase of surface FGFR1 produced by TUDCA alone. L TUDCA restored Tu-induced loss of FGF2-mediated FGFR1 phosphorylation (p) (graph, signal quantification). BiP was used to monitor ER stress, actin serves as loading control. Statistical significances were calculated using Student´s t-test (p < 0·05; ** p < 0·01, *** p < 0·001); n.s. – not significant. Bar and line plots – mean ± S.E. n, number of independent experiments
Fig. 6
Fig. 6
ER stress disrupts signaling via altered processing of transmembrane receptors. Transmembrane receptors transition through the ER-Golgi system during their biogenesis. When folded, modified and matured, the receptors are presented at the cell surface, bind their cognate ligands and initiate downstream signaling. Deterioration of ER function during ER stress alters receptor production, causes improper folding and degradation, or interferes with transport causing intracellular receptor accumulation. Collectively, these changes lead to loss of signaling-competent receptor molecules at the cell surface and impaired communication

References

    1. Hetz C, Zhang K, Kaufman RJ. Mechanisms, regulation and functions of the unfolded protein response. Nat Rev Mol Cell Biol. 2020;21(8):421–38. - PMC - PubMed
    1. Wang M, Kaufman RJ. The impact of the endoplasmic reticulum protein-folding environment on cancer development. Nat Rev Cancer. 2014;14(9):581–97. - PubMed
    1. Cox JS, Shamu CE, Walter P. Transcriptional induction of genes encoding endoplasmic reticulum resident proteins requires a transmembrane protein kinase. Cell. 1993;73:1197–206. - PubMed
    1. Harding HP, Zhang Y, Ron D. Protein translation and folding are coupled by an endoplasmic-reticulum-resident kinase. Nature. 1999;397:271–4. - PubMed
    1. Haze K, Yoshida H, Yanagi H, Yura T, Mori K. Mammalian transcription factor ATF6 is synthesized as a transmembrane protein and activated by proteolysis in response to endoplasmic reticulum stress. Mol Biol Cell. 1999;10:3787–99. - PMC - PubMed

MeSH terms

Substances

LinkOut - more resources