. 2025 May 1;44(1):136.
doi: 10.1186/s13046-025-03379-7.

Extracellular vesicle digital scoring assay for assessment of treatment responses in hepatocellular carcinoma patients

Affiliations

Extracellular vesicle digital scoring assay for assessment of treatment responses in hepatocellular carcinoma patients

Chen Zhao et al. J Exp Clin Cancer Res. .

Abstract

Background: There are no validated biomarkers for assessing hepatocellular carcinoma (HCC) treatment response (TR). Extracellular vesicles (EVs) are promising circulating biomarkers that may detect minimal residual disease in patients with treated HCC.

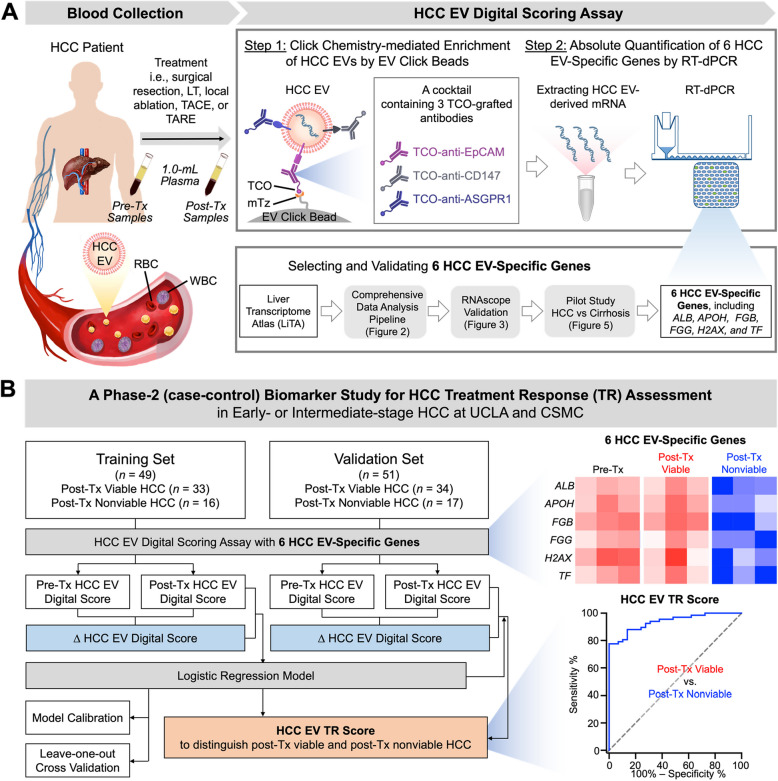
Methods: We developed the HCC EV TR Score using HCC EV Digital Scoring Assay involving click chemistry-mediated enrichment of HCC EVs, followed by absolute quantification of HCC EV-specific genes by RT-digital PCR. Six HCC EV-specific genes were selected and validated through i) a comprehensive data analysis pipeline with an unprecedentedly large collection of liver transcriptome datasets (n = 9,160), ii) RNAscope validation on HCC tissues (n = 6), and iii) a pilot study on early- or intermediate-stage HCC and liver cirrhosis patients (n = 70). The performance of HCC EV TR Score was assessed in a phase-2 retrospective case-control study (n = 100).

Results: HCC EV TR Scores, calculated from pre- and post-treatment plasma samples in the phase-2 case-control study, accurately differentiated post-treatment viable from nonviable HCC in the training (area under the ROC curve [AUROC] of 0.90, n = 49) and validation set (AUROC of 0.88, n = 51). At an optimal cutoff of 0.76 identified in the training set, HCC EV TR Score had high accuracy in detecting viable tumors (sensitivity: 76.5%, specificity: 88.2%) and found residual disease not initially observed on MRI in six patients with a median lead time of 63 days.

Conclusions: This EV-based digital scoring approach shows great promise to augment cross-sectional imaging for the assessment of HCC treatment response.

Keywords: Extracellular Vesicle; Hepatocellular Carcinoma; Liquid Biopsy; Treatment Responses.


Conflict of interest statement

Declarations. Ethics approval and consent to participate: This study was approved by the Office of the Human Research Protection Program at University of California, Los Angeles (#14–000197, #10–000236-AM- 00021 and #20–001197) and the Office of Research Compliance and Quality Improvement at Cedars-Sinai Medical Center (#00000066, #00042197, and #00033050). Samples were collected only after obtaining written informed consent from the participants. Consent for publication: Not applicable. The manuscript does not contain any individual personal data. Competing interests: Dr. Ju Dong Yang provides a consulting service for FujiFilm Medical Sciences, Exact Sciences, AstraZeneca, Eisai, Exelixis, and Merck. Dr. Yazhen Zhu is a co-founder and shareholder in Eximius Diagnostics Corp.. Dr. Hsian-Rong Tseng would like to disclose that he has financial interests in CytoLumina Technologies Corp., Pulsar Therapeutics Corp., and. Eximius Diagnostics Corp. Dr. Vatche Agopian provides a consulting service for Merck, Eximius Diagnostics Corp, and Early Diagnostics Corp. Dr. Amit Singal has served as a consultant or on advisory boards for Genentech, AztraZeneca, Eisai, Exelixis, Bayer, Elevar, Boston Scientific, Sirtex, Histosonics, FujiFilm Medical Sciences, Exact Sciences, Roche, Abbott, Glycotest, Freenome, and GRAIL.

Figures

Fig. 1
Fig. 1
An HCC EV Digital Scoring Assay for HCC TR assessment. A The HCC EV Digital Scoring Assay is composed of a two-step workflow – Step 1: click chemistry-mediated enrichment of HCC EVs in 1.0-mL plasma by EV Click Beads in conjunction with the use of a cocktail of three TCO-grafted antibodies, and Step 2: absolute quantification of six HCC EV-specific genes by RT-dPCR. These six HCC EV-specific genes were selected and validated through i) a comprehensive data analysis pipeline based on our proprietary LiTA database, ii) RNAscope validation on HCC tissues and iii) a pilot study on early- or intermediate-stage HCC and liver cirrhosis patients. B A phase-2 retrospective case–control biomarker study was developed to evaluate the refined HCC EV Digital Scoring Assay for HCC TR assessment (i.e., distinguish post-Tx viable from nonviable HCC). Pre- and post-Tx plasma samples were collected from 100 patients with early- or intermediate-stage HCC, who received surgical resection, LT, local ablation, TARE, or TACE. The clinical status of these patients was classified as either post-Tx viable or nonviable in a 2:1 ratio. These patients were randomly divided into a training set (n = 49) and a validation set (n = 51). In the training set, all plasma samples were subjected to HCC EV Digital Scoring Assay to generate the respective pre-Tx and post-Tx HCC EV Digital Scores, and ∆ HCC EV Digital Scores (by subtracting the post-Tx with pre-Tx Scores). A logistic regression model was applied to integrate post-Tx HCC EV Digital Scores and ∆ HCC EV Digital Scores to establish HCC EV TR Scores, enabling effective differentiation of post-Tx viable and nonviable HCC. Subsequently, the study on the validation set reproduced the diagnostic efficacy of the HCC EV TR Scores for HCC TR assessment. ASGPR1, asialoglycoprotein receptor 1; CSMC, Cedars-Sinai Medical Center; EpCAM, epithelial cellular adhesion molecule; EV, extracellular vesicle; HCC, hepatocellular carcinoma; LiTA, Liver Transcriptome Atlas; LT, liver transplantation; mTz, methyltetrazine; RBC, red blood cell; RT-dPCR, reverse-transcription digital PCR; TACE, transarterial chemoembolization; TARE, transarterial radioembolization; TCO, trans-cyclooctene; TR, treatment response; Tx, treatment; UCLA, University of California, Los Angeles; WBC, white blood cell
Fig. 2
Fig. 2
A comprehensive data analysis pipeline for identifying 12 HCC EV-specific gene candidates. The pipeline begins with the preparation of our proprietary LiTA database, which was established by aggregating publicly available liver transcriptome data from 59 cohorts (n = 9,160) obtained from the GEO and Array Express repositories, resulting in 16,296 gene expression profiles for 8,685 liver tissue specimens. In the gene selection process, the top 16 HCC EV-specific gene candidates were selected through the following four steps: i) selecting upregulated genes across four etiology-based comparisons; ii) selecting highly expressed genes in HCC cell lines using CCLE dataset; iii) excluding highly expressed genes in immune cells using DMAP dataset; iv) selecting highly expressed genes in HCC EVs using exoRBase 2.0. qPCR was employed to measure the differential expression of the top 16 HCC EV-specific gene candidates in HepG2 cells and WBCs (Scale: 40 – cycle threshold value). Six genes (SORT1, ATAD2, H2AX, PUF60, TUBG1, and UBL4 A) with the top-ranking differential expressions (high in HepG2 cells and low in WBCs) were selected. In parallel, another six genes (ALB, FABP1, FGB, APOH, FGG, and TF) with performance in distinguishing early-stage HCC from liver cirrhosis were also identified. Combining these findings, we identified the 12 HCC EV-specific gene candidates. ALD, alcoholic liver disease; CCLE, Cancer Cell Line Encyclopedia dataset; DMAP, Differentiation MAP dataset; EV, extracellular vesicle; GEO, Gene Expression Omnibus; HBV, hepatitis B virus; HCC, hepatocellular carcinoma; HCV, hepatitis C virus; HDV, hepatitis D virus; LiTA, Liver Transcriptome Atlas; MASLD, metabolic dysfunction-associated steatotic liver disease; MGH, Massachusetts General Hospital; qPCR, quantitative PCR; WBC, white blood cell
Fig. 3
Fig. 3
Validation of 12 HCC EV-specific gene candidates using RNAscope. A Representative RNAscope in situ hybridization for 12 HCC EV-specific mRNA candidates and immunofluorescent staining of CD147 (HCC-associated surface protein marker) were performed on HCC tissues and their corresponding negative surgical margins. B The percentage of cells with positive mRNA staining (intensity levels 1 to 3) for the 12 markers is summarized in a bar chart. Statistical significance between groups was determined using the Chi-square test. EV, extracellular vesicle; HCC, hepatocellular carcinoma
Fig. 4
Fig. 4
Linearity studies of HCC EV Digital Scoring Assay. A Linearity studies of HCC EV Digital Scoring Assay using synthetic plasma sample, prepared by serially spiking HepG2 EVs into the EV-depleted HD plasma. EV Click Beads were utilized to enrich HepG2 EVs in conjunction with the cocktail of the 3 TCO-antibodies targeting EpCAM, CD147, and ASGPR1. RT-dPCR was performed to obtain the absolute quantification of 12 HCC EV-specific gene candidates. B Robust linearity correlations were identified between the concentration of spiked HepG2 EVs and measured mRNA copy numbers for all 12 HCC EV-specific gene candidates over the concentration range of 0 – 6 × 109 HepG2 EVs per µL, with R-squared values ranging from 0.991 to 0.999. ASGPR1, asialoglycoprotein receptor 1; EpCAM, epithelial cellular adhesion molecule; EV, extracellular vesicle; HCC, hepatocellular carcinoma; HD, healthy donor; RT-dPCR, reverse-transcription digital PCR; TCO, trans-cyclooctene
Fig. 5
Fig. 5
A pilot study to refine the 6 HCC EV-specific genes from the 12 HCC EV-specific gene candidates and calculate HCC EV Digital Score. A To refine the 6 HCC EV-specific genes from the 12 HCC EV-specific gene candidates, a pilot study of HCC EV Digital Scoring Assay was conducted to differentiate early- or intermediate-stage Tx-naïve HCC (BCLC 0-B, n = 35) from liver cirrhosis (n = 35), where the disease window of the HCC cases matched that of the HCC TR assessment cohort. B The 6 differentially expressed genes ALB, APOH, FGB, FGG, H2 AX, and TF, capable of better differentiating early- or intermediate-stage HCC from liver cirrhosis were identified. C Heatmaps summarizing relative intensities of the 6 HCC EV-specific genes across the early- or intermediate-stage HCC and liver cirrhosis patients. Scale: log2(transcript + 1). D A weighted Z-score formula and the respective weights of the six genes were developed to integrate the 6-gene readouts into HCC EV Digital Scores. In this formula, i represents each gene, with weights assigned based on the relative signal-to-noise ratio in the average gene copies (log2 transformed) of HCC patients relative to those of cirrhosis patients. E Boxplot summarizing the HCC EV Digital Scores calculated for the early- or intermediate-stage HCC and liver cirrhosis patients. F Receiver operating characteristic (ROC) curves of HCC EV Digital Score for differentiating early- or intermediate-stage HCC and liver cirrhosis patients (AUROC = 0.85, 95% CI: 0.76—0.94). AUROC, area under the receiver operating characteristic curve; EV, extracellular vesicle; HCC, hepatocellular carcinoma; ROC, receiver operating characteristic; RT-dPCR, reverse-transcription digital PCR
Fig. 6
Fig. 6
Establishment of HCC EV TR Scores for differentiating post-Tx viable and post-Tx nonviable HCC in the training set (n = 49). A Pre-Tx and post-Tx plasma samples from each HCC patient were subjected to the refined HCC EV Digital Scoring Assay to generate the respective pre-Tx and post-Tx HCC EV Digital Scores and calculate ∆ HCC EV Digital Scores by subtracting the post-Tx from pre-Tx Scores. A logistic regression model was developed to synergistically combine the post-Tx HCC EV Digital Scores and ∆ HCC EV Digital Scores to establish their HCC EV TR Scores. B Ladder plots summarizing the pre-Tx and post-Tx HCC EV Digital Scores for the 33 post-Tx viable HCC patients and 16 post-Tx nonviable HCC patients. C/D Boxplots summarizing ∆ HCC EV Digital Scores and HCC EV TR Scores of the 33 post-Tx viable HCC patients and the 16 post-Tx nonviable HCC patients. The dashed line indicates the optimal cutoff of 0.76. E ROC curve of HCC EV TR Score for differentiating post-Tx viable HCC from post-Tx nonviable HCC in the training set. F ROC curve after leave-one-out cross-validation for differentiating post-Tx viable HCC from post-Tx nonviable HCC in the training set. AUROC, area under receiver operating characteristic curve; EV, extracellular vesicle; HCC, hepatocellular carcinoma; LT, liver transplantation; ROC, receiver operating characteristic; RT-dPCR, reverse-transcription digital PCR; TACE, transarterial chemoembolization; TARE, transarterial radioembolization; TR, treatment response; Tx, treatment
Fig. 7
Fig. 7
Validation of HCC EV TR Scores for differentiating post-Tx viable and post-Tx nonviable HCC in the validation set (n = 51). A Ladder plots summarizing the paired pre-Tx and post-Tx HCC EV Digital Scores for 34 post-Tx viable HCC patients and 17 post-Tx nonviable HCC patients. B Boxplots summarizing ∆ HCC EV Digital Scores for the 34 post-Tx viable HCC and 17 post-Tx nonviable HCC patients. C Boxplots showing the HCC EV TR Scores of the post-Tx viable and post-Tx nonviable HCC. The dashed line indicates the optimal cutoff of 0.76, calculated in the training set. D ROC curve of HCC EV TR Score for differentiating post-Tx viable HCC from post-Tx nonviable HCC in the validation set. E ROC curves of HCC EV TR Score, post-Tx serum AFP, and ∆ AFP in the combined training and validation set (98 patients with serum AFP data available). P = 0.0002 compared with post-Tx AFP and P < 0.0001 compared with ∆AFP using the paired DeLong’s test. AUROC, area under receiver operating characteristic curve; EV, extracellular vesicle; HCC, hepatocellular carcinoma; TR, treatment response; Tx, treatment
Fig. 8
Fig. 8
Case study of post-Tx recurrence in six HCC patients with false negative cross-sectional imaging assessment and positive HCC EV TR Score readouts. A swimmer plot illustrates the clinical histories of 6 HCC patients who exhibited discrepancies between their cross-sectional imaging assessment and HCC EV TR Score readouts. Each horizontal bar represents an individual patient's timeline from the initial Tx date (x-axis) to post-Tx recurrence based on cross-sectional imaging assessment. Blue triangles indicate the time points of initial cross-sectional imaging. Based on the LR-TR algorithm, all patients were classified as post-Tx nonviable HCC. Yet, their HCC EV TR Scores were above the optimal cutoff of 0.76, suggesting post-Tx viable status. Subsequent follow-up imaging confirmed the presence of viable lesions, consistent with the prediction by HCC EV TR Scores. TACE, transarterial chemoembolization; TARE, transarterial radioembolization; Tx, treatment

References

    1. Chidambaranathan-Reghupaty S, Fisher PB, Sarkar D. Hepatocellular carcinoma (HCC): Epidemiology, etiology and molecular classification. Adv Cancer Res. 2021;149:1–61. - PMC - PubMed
    1. Siegel RL, Miller KD, Wagle NS, Jemal A. Cancer statistics, 2023. CA Cancer J Clin. 2023;73:17–48. - PubMed
    1. Lee YT, Wang JJ, Luu M, Noureddin M, Kosari K, Agopian VG, Rich NE, Lu SC, Tseng HR, Nissen NN, et al. The Mortality and Overall Survival Trends of Primary Liver Cancer in the United States. J Natl Cancer Inst. 2021;113:1531–41. - PMC - PubMed
    1. Yang JD, Hainaut P, Gores GJ, Amadou A, Plymoth A, Roberts LR. A global view of hepatocellular carcinoma: trends, risk, prevention and management. Nat Rev Gastroenterol Hepatol. 2019;16:589–604. - PMC - PubMed
    1. Singal AG, Llovet JM, Yarchoan M, Mehta N, Heimbach JK, Dawson LA, Jou JH, Kulik LM, Agopian VG, Marrero JA, et al. AASLD Practice Guidance on prevention, diagnosis, and treatment of hepatocellular carcinoma. Hepatology. 2023;78:1922–65. - PMC - PubMed

MeSH terms

Substances