. 2025 Jun;16(3):e13818.
doi: 10.1002/jcsm.13818.

Integrated Multiomics Analyses of the Molecular Landscape of Sarcopenia in Alcohol-Related Liver Disease

Affiliations

Integrated Multiomics Analyses of the Molecular Landscape of Sarcopenia in Alcohol-Related Liver Disease

Nicole Welch et al. J Cachexia Sarcopenia Muscle. 2025 Jun.

Abstract

Background: Skeletal muscle is a major target for ethanol-induced perturbations, leading to sarcopenia in alcohol-related liver disease (ALD). The complex interactions and pathways involved in adaptive and maladaptive responses to ethanol in skeletal muscle are not well understood. Unlike hypothesis-driven experiments, an integrated multiomics-experimental validation approach provides a comprehensive view of these interactions.

Methods: We performed multiomics analyses with experimental validation to identify novel regulatory mechanisms of sarcopenia in ALD. Studies were done in a comprehensive array of models including ethanol-treated (ET) murine and human-induced pluripotent stem cell-derived myotubes (hiPSCm), skeletal muscle from a mouse model of ALD (mALD) and human patients with alcohol-related cirrhosis and controls. We generated 13 untargeted datasets, including chromatin accessibility (assay for transposase accessible chromatin), RNA sequencing, proteomics, phosphoproteomics, acetylomics and metabolomics, and conducted integrated multiomics analyses using UpSet plots and feature extraction. Key findings were validated using immunoblots, redox measurements (NAD+/NADH ratio), imaging and senescence-associated molecular phenotype (SAMP) assays. Mechanistic studies included mitochondrial-targeted Lactobacillus brevis NADH oxidase (MitoLbNOX) to increase redox ratio and MitoTempo as a mitochondrial free radical scavenger.

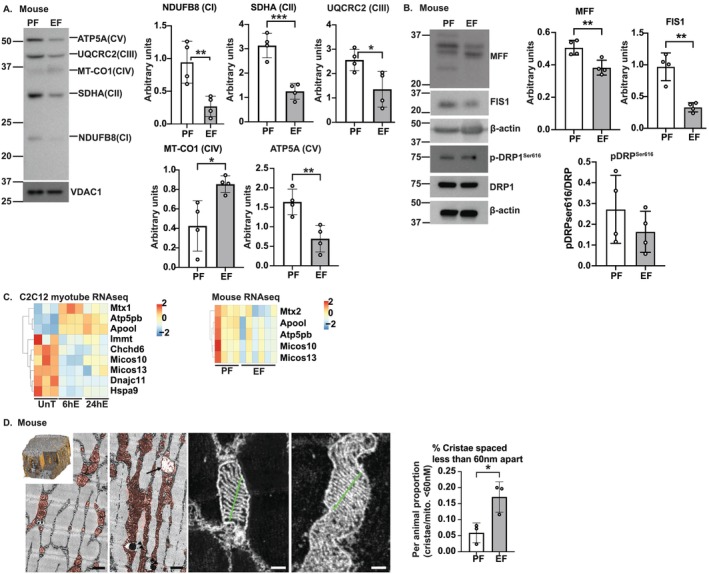
Results: Multiomics analyses revealed enrichment in mitochondrial oxidative function, protein synthesis and senescence pathways consistent with the known effects of hypoxia-inducible factor 1α (HIF1α) during normoxia. Across preclinical and clinical models, HIF1α targets (n = 32 genes) and signalling genes (n > 100 genes) (n = 3 ATACseq, n = 65 phosphoproteomics, n = 10 acetylomics, n = 6 C2C12 proteomics, n = 106 C2C12 RNAseq, n = 64 hiPSC RNAseq, n = 30 hiPSC proteomics, n = 3 mouse proteomics, n = 25 mouse RNAseq, n = 8 human RNAseq, n = 3 human proteomics) were increased. Stabilization of HIF1α (C2C12, 6hEtOH 0.24 ± 0.09; p = 0.043; mALD 0.32 ± 0.074; p = 0.005; data shown as mean difference ± standard error mean) was accompanied by enrichment in the early transient and late change clusters, -log(p-value) = 1.5-3.8, of the HIF1α signalling pathway. Redox ratio was reduced in ET myotubes (C2C12: 15512 ± 872.1, p < 0.001) and mALD muscle, with decreased expression of electron transport chain components (CI-V, p < 0.05) and Sirt3 (C2C12: 0.067 ± 0.023, p = 0.025; mALD: 0.41 ± 0.12, p = 0.013). Acetylation of mitochondrial proteins was increased in both models (C2C12: 107364 ± 4558, p = 0.03; mALD: 40036 ± 18 987, p = 0.049). Ethanol-induced SAMP was observed across models (P16: C2C12: 0.2845 ± 0.1145, p < 0.05; hiPSCm: 0.2591, p = 0.041). MitoLbNOX treatment reversed redox imbalance, HIF1α stabilization, global acetylation and myostatin expression (p < 0.05).

Conclusions: An integrated multiomics approach, combined with experimental validation, identifies HIF1α stabilization and accelerated post-mitotic senescence as novel mechanisms of sarcopenia in ALD. These findings show the complex molecular interactions leading to mitochondrial dysfunction and progressive sarcopenia in ALD.

Keywords: alcohol‐related liver disease; hypoxia‐inducible factor‐1‐alpha; mitochondrial oxidative dysfunction; protein acetylation; redox ratio; sarcopenia; senescence; sirtuins.


Conflict of interest statement

The authors declare no conflicts of interest.

Figures

FIGURE 1
FIGURE 1
Differentially expressed molecules show conserved regulators of cellular function with ethanol. Assay for transposase accessible chromatin sequencing (ATACseq), RNA sequencing (RNAseq; Q), proteomics (P), phosphoproteomics (Pp), acetylomics (Ac) and metabolomics was generated in differentiated murine C2C12 (c) and human‐induced pluripotent stem cell–derived (h) myotubes treated without (UnT)/with 100 mM ethanol (EtOH) for 6 and 24 h, gastrocnemius muscle from mouse model of alcohol‐associated liver disease and humans with alcohol‐associated cirrhosis/healthy controls. Differentially expressed molecules (DEMs) were identified. (A) UpSet plot: Y‐axis is the number of shared molecules between datasets. Dots represent dataset(s) containing DEMs. (B) Line diagram and heatmaps showing temporal clusters of responses in murine myotubes—early transient: change only at 6 h EtOH; late: change only at 24 h EtOH; persistent: change at both 6 h EtOH and 24 h EtOH versus UnT; and pseudosilent: change only at 24 h EtOH versus 6 h EtOH. (C) Functional enrichment using QIAGEN Ingenuity Pathway Analysis. (D) Functional enrichment within early transient and late change temporal clusters. (E) Pathway impact dot‐plot of untargeted metabolomics at 24 h EtOH in myotubes. Higher impact values indicate the relative significance of a pathway. Circle size: impact; circle colour: increasing significance from white to red. (F) Integrated hierarchical scatterplots of intersecting DEMs that are HIF1α targets. The dot colour corresponds to the dataset. Significance cutoffs: for ATACseq (p < 0.005); RNAseq myotubes (p‐adjusted < 0.05); all others p < 0.05. Red box: Critical components experimentally validated.
FIGURE 2
FIGURE 2
Ethanol‐induced mitochondrial structural and functional perturbations in myotubes. Differentiated C2C12 or human‐induced pluripotent stem cell–derived myotubes were treated without (UnT)/with 3, 6 or 24 h 100 mM ethanol (EtOH). Representative immunoblots and densitometries of (A,B) components of each electron transport chain complex; (C,D) mitochondrial structural proteins dynamin‐related protein 1 (DRP1), phosphorylated‐DRP1Ser616, fission, mitochondrial 1 (FIS1) and mitochondrial fission factor (MFF); (E) representative confocal photomicrographs and violin plots. Orange: MitoTracker Orange stained mitochondria. n = 30 measurements each from n = 3 biological replicates per treatment. Scale bar: 5 mm. (F) Mitochondrial oxygen consumption by high‐resolution respirometry in response to substrate–uncoupler–inhibitor titration. Intact cell respiration, oxidative phosphorylation (OXPHOS) + ADP(D), maximum respiration (Max. R.), reserve respiratory capacity (R.R.), rotenone (Rot.)‐sensitive and ‐insensitive respiration. Data mean ± SD from n ≥ 3. 2‐groups: Student's t‐test. > 2‐groups: One‐way ANOVA and uncorrected Fisher's LSD. *p < 0.05; **p < 0.01; ***p < 0.001. Loading control shown: (B) VDAC1: OxPhos CV/CII/CI. (C) β‐actin: MFF; (D) β‐actin: FIS1/MFF.
FIGURE 3
FIGURE 3
Mitochondrial perturbations in skeletal muscle in mice with alcohol‐associated liver disease. Studies were done in gastrocnemius muscle from pair‐fed (PF) or mice‐fed ethanol (EF) and C2C12 myotubes without/with 100 mM ethanol (EtOH) treatment for 6 and 24 h. (A,B) Representative immunoblots and densitometries of mouse skeletal muscle: (A) Components of each electron transport chain complex. (B) Mitochondrial structural proteins dynamin‐related protein 1 (DRP1), phosphorylated‐DRP1Ser616, fission, mitochondrial 1 (FIS1) and mitochondrial fission factor (MFF). (C) Heatmaps of differentially expressed molecules in RNAseq from myotubes and mouse skeletal muscle (REACTOME cristae formation geneset). (D) Cristae spacing using three‐dimensional electron microscopy (3D EM) of murine gastrocnemius muscle (inset: reconstructed muscle fibre, orange: mitochondria). Data mean ± SD from n ≥ 3 per group. Scale bars 1 μm (black), 0.5 μm (white). 2‐groups: Student's t‐test. *p < 0.05; **p < 0.01; ***p < 0.001. β‐actin shown from FIS1, p‐DRP1Ser616.
FIGURE 4
FIGURE 4
Ethanol‐induced lower redox ratio causes global acetylation and less sirtuin expression in myotubes and skeletal muscle. Studies done in differentiated murine and human‐induced pluripotent stem cell–derived (hiPSC) myotubes and skeletal muscle from mice (ethanol‐ and pair‐fed [EF and PF]) and humans without/with cirrhosis. (A) UpSet plot of adenine dinucleotide pathway genes. Y‐axis: number of shared molecules between datasets. Dots: dataset(s) containing shared/unique differentially expressed molecules. (B) Fluorescence‐based quantification of NAD+, NADH and the NAD+/NADH ratio in hiPSC myotubes. (C) Subcellular acetylomics in myotubes. (D,E) Representative immunoblots and densitometry of global protein acetylation. (F) Representative immunoblots and densitometry of global acetylation in mitochondrial, cytosolic and nuclear subcellular fractions. Significance cutoffs: ATACseq (p < 0.005); myotube RNAseq (p‐adjusted < 0.05); all others (p < 0.05). All experimental data mean ± SD from n ≥ 3 using one‐way ANOVA with uncorrected Fisher's LSD. *p < 0.05; **p < 0.01; ***p < 0.001.
FIGURE 5
FIGURE 5
Redox ratio regulates sirtuin expression and acetylation during ethanol treatment. Studies were done in differentiated murine C2C12 myotubes treated without/with 6 or 24 h of 100 mM ethanol (EtOH) and skeletal muscle from pair‐ and ethanol‐fed (PF and EF) mice. Representative immunoblots and densitometries of Sirtuins (Sirt1–7) in (A) myotubes, (B) mouse skeletal muscle; (C) Sirt3 in response to mitochondrial‐directed Lactobacillus brevis NADH oxidase (MitoLbNOX) with ethanol treatment in myotubes and UpSet plot of differentially expressed Sirt3 target genes across datasets. Expression of (D) acetylated protein without/with MitoLbNOX in myotubes; (E) myostatin (MSTN) in myotubes and muscle; (F) MSTN in without/with MitoLbNOX. Data mean ± SD from n = 3 (myotubes); n = 4 (mice)/group. 2‐groups: Student's t‐test; > 2‐groups: One‐way ANOVA with uncorrected Fisher's LSD. *p < 0.05; **p < 0.01; ***p < 0.001. Significance: ATACseq (p < 0.005); myotube RNAseq (p‐adjusted < 0.05); others (p < 0.05). β‐actin shown from (A) Sirt1/3/5/7 and (B) Sirt6/7.
FIGURE 6
FIGURE 6
HIF1α transcription factor alterations in skeletal muscle in response to ethanol. Differentiated murine C2C12 or induced human pluripotent stem cell–derived myotubes (hiPSCm) myotubes treated with 6 and 24 h 100 mM EtOH and skeletal muscle from pair‐ and ethanol‐fed (PF and EF) mice and human patients. (A) ATAC‐seq footprinting plot showing decreased accessibility for all hypoxia‐inducible factor‐1α (aryl hydrocarbon receptor nuclear translocator) motifs at 6 h EtOH versus UnT. (B) Heatmaps of HIF1α target/signalling molecules. (C) Reporter assay for HIF1α. (D,E) Representative immunoblots and densitometry of hypoxia‐inducible factor (HIF) 1α, HIF1β, HIF2α, aryl hydrocarbon receptor (AHR). (F) Representative photomicrographs of myotubes stained with [2‐(2‐nitro‐lH‐imidazol‐l‐yl)‐N‐(2,2,3,3,3‐pentafluoropropyl) acetamide] EF5 (red) for hypoxia and 4′,6‐diamidino‐2‐phenylindole (DAPI) for nuclei in myotubes grown at 20% and 1% O2. Significance: ATACseq (p < 0.005); myotube RNAseq (p‐adjusted < 0.05); others (p < 0.05). Data mean ± SD from n ≥ 3 biological replicates. 2‐groups: Student's t‐test; > 2‐groups: One‐way ANOVA with uncorrected Fisher's LSD. *p < 0.05; **p < 0.01; ***p < 0.001. β‐actin shown for (E) HIF1β (C2C12); HIF1β (mouse). RLU: Relative luciferase units.
FIGURE 7
FIGURE 7
Reversal of acetylation and expression of HIF1α. Studies done in differentiated murine C2C12 myotubes treated without/with 6 or 24 h of 100 mM ethanol (EtOH) transfected with/without mitochondrial‐directed Lactobacillus brevis NADH oxidase (MitoLbNOX), MitoTempo or MitoQ. Representative immunoblots and densitometries of (A) hypoxia‐inducible factor‐1a (HIF1α) without/with MitoLbNOX; (B,C) global acetylation; and (D,E) HIF1α without/with MitoTempo or MitoQ. Data mean ± SD, n ≥ 3 biological replicates. One‐way ANOVA with uncorrected Fisher's LSD. *p < 0.05; **p < 0.01; ***p < 0.001.
FIGURE 8
FIGURE 8
Ethanol causes senescence‐associated molecular phenotype in myotubes and skeletal muscle. Studies done in differentiated murine and human‐induced pluripotent stem cell–derived (hiPSC) myotubes treated with 100 mM ethanol (EtOH) and skeletal muscle from humans with/without alcohol‐associated cirrhosis). (A) STRING network and functional enrichment analyses from human and murine myotube RNAseq. (B) Representative immunoblots and densitometry of senescence markers, p16, p21 and phosphorylated‐p53Ser15 and senescence‐associated β‐galactosidase activity in murine and hiPSC myotubes. 4‐MU: 4‐methyl‐umbelliferone. RFU: Relative fluorescence unit. (C) Representative photomicrographs and diameter of hiPSC myotubes. (D) Luciferase reporter assay for Bmal1 activity. (E) Study schematic. Data mean ± SD from n ≥ 3. Significance cutoffs: myotube RNAseq (p‐adjusted < 0.05); human RNAseq (p < 0.05). 2‐groups: Student's t‐test; > 2‐groups: One‐way ANOVA with uncorrected Fisher's LSD. *p < 0.05; **p < 0.01; ***p < 0.001. β‐actin from (B) P21, p‐P53 (C2C12) and P16 (hiPSC).

References

    1. Welch N., Dasarathy J., Runkana A., et al., “Continued Muscle Loss Increases Mortality in Cirrhosis: Impact of Aetiology of Liver Disease,” Liver International 40 (2020): 1178–1188. - PMC - PubMed
    1. Dasarathy J., McCullough A. J., and Dasarathy S., “Sarcopenia in Alcoholic Liver Disease: Clinical and Molecular Advances,” Alcoholism, Clinical and Experimental Research 41 (2017): 1419–1431. - PMC - PubMed
    1. Simon L., Jolley S. E., and Molina P. E., “Alcoholic Myopathy: Pathophysiologic Mechanisms and Clinical Implications,” Alcohol Research: Current Reviews 38 (2017): 207–217. - PMC - PubMed
    1. Kant S., Davuluri G., Alchirazi K. A., et al., “Ethanol Sensitizes Skeletal Muscle to Ammonia‐Induced Molecular Perturbations,” Journal of Biological Chemistry 294 (2019): 7231–7244. - PMC - PubMed
    1. Singh S. S., Kumar A., Welch N., et al., “Multiomics‐Identified Intervention to Restore Ethanol‐Induced Dysregulated Proteostasis and Secondary Sarcopenia in Alcoholic Liver Disease,” Cellular Physiology and Biochemistry 55 (2021): 91–116. - PMC - PubMed