

Synaptic Function and Sensory Processing in ZDHHC9-Associated Neurodevelopmental Disorder: A Mechanistic Account
- PMID: 40308169
- PMCID: PMC12044517
- DOI: 10.1111/ejn.70124
Synaptic Function and Sensory Processing in ZDHHC9-Associated Neurodevelopmental Disorder: A Mechanistic Account
Abstract
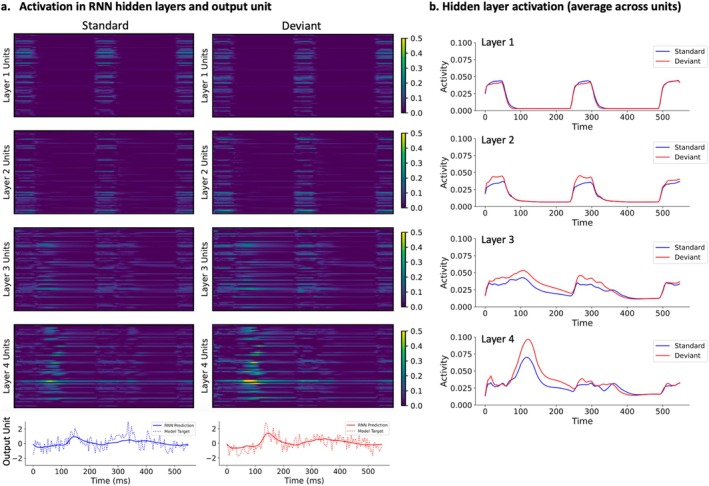
Loss-of-function ZDHHC9 variants are associated with X-linked intellectual disability (XLID), rolandic epilepsy (RE) and developmental language difficulties. This study integrates human neurophysiological data with a computational model to identify a potential neural mechanism explaining ZDHHC9-associated differences in cortical function and cognition. Magnetoencephalography (MEG) data was collected during an auditory roving oddball paradigm from eight individuals with a ZDHHC9 loss-of-function variant (ZDHHC9 group) and seven age-matched individuals without neurological or neurodevelopmental difficulties (control group). Auditory-evoked fields (AEFs) were larger in amplitude and showed a later peak latency in the ZDHHC9 group but demonstrated normal stimulus-specific properties. Magnetic mismatch negativity (mMMN) amplitude was also increased in the ZDHHC9 group, reflected by stronger neural activation during deviant processing relative to the standard. A recurrent neural network (RNN) model was trained to mimic group-level auditory-evoked responses, and subsequently perturbed to test the hypothesised impact of ZDHHC9-driven synaptic dysfunction on neural dynamics. Results of model perturbations showed that reducing inhibition levels by weakening inhibitory weights recapitulates the observed group differences in evoked responses. Stronger reductions in inhibition levels resulted in increased peak amplitude and peak latency of RNN prediction relative to the pre-perturbation predictions. Control experiments in which excitatory connections were strengthened by the same levels did not result in consistently stable activity or AEF-like RNN predictions. Together, these results suggest that reduced inhibition is a plausible mechanism by which loss of ZDHHC9 function alters cortical dynamics during sensory processing.
Keywords: MEG; ZDHHC9; epilepsy; intellectual disability; language; recurrent neural networks.
© 2025 The Author(s). European Journal of Neuroscience published by Federation of European Neuroscience Societies and John Wiley & Sons Ltd.
Conflict of interest statement
The authors declare no conflicts of interest.
Figures


Similar articles
-
Functional network dynamics in a neurodevelopmental disorder of known genetic origin.Hum Brain Mapp. 2020 Feb 1;41(2):530-544. doi: 10.1002/hbm.24820. Epub 2019 Oct 22. Hum Brain Mapp. 2020. PMID: 31639257 Free PMC article.
-
The X-Linked Intellectual Disability Gene Zdhhc9 Is Essential for Dendrite Outgrowth and Inhibitory Synapse Formation.Cell Rep. 2019 Nov 19;29(8):2422-2437.e8. doi: 10.1016/j.celrep.2019.10.065. Cell Rep. 2019. PMID: 31747610
-
Auditory evoked fields measured noninvasively with small-animal MEG reveal rapid repetition suppression in the guinea pig.J Neurophysiol. 2014 Dec 15;112(12):3053-65. doi: 10.1152/jn.00189.2014. Epub 2014 Sep 17. J Neurophysiol. 2014. PMID: 25231619 Free PMC article.
-
Expanding the molecular basis and phenotypic spectrum of ZDHHC9-associated X-linked intellectual disability.Am J Med Genet A. 2018 May;176(5):1238-1244. doi: 10.1002/ajmg.a.38683. Am J Med Genet A. 2018. PMID: 29681091 Review.
-
Auditory processing that leads to conscious perception: a unique window to central auditory processing opened by the mismatch negativity and related responses.Psychophysiology. 2011 Jan;48(1):4-22. doi: 10.1111/j.1469-8986.2010.01114.x. Epub 2010 Sep 29. Psychophysiology. 2011. PMID: 20880261 Review.
References
-
- Ahmmed, A. U. , Clarke E. M., and Adams C.. 2008. “Mismatch Negativity and Frequency Representational Width in Children With Specific Language Impairment.” Developmental Medicine and Child Neurology 50, no. 12: 938–944. - PubMed
-
- Baldeweg, T. , Richardson A., Watkins S., Foale C., and Gruzelier J.. 1999. “Impaired Auditory Frequency Discrimination in Dyslexia Detected With Mismatch Evoked Potentials.” Annals of Neurology 45, no. 4: 495–503. - PubMed
MeSH terms
Substances
Grants and funding
LinkOut - more resources
Full Text Sources
