

Intratumoral and peritumoral radiomics based on automated breast volume scanner for predicting human epidermal growth factor receptor 2 status
- PMID: 40308512
- PMCID: PMC12041018
- DOI: 10.3389/fonc.2025.1556317
Intratumoral and peritumoral radiomics based on automated breast volume scanner for predicting human epidermal growth factor receptor 2 status
Abstract
Purpose: To develop an intratumoral and peritumoral radiomics model using Automated Breast Volume Scanner (ABVS) for noninvasive preoperative prediction of Human Epidermal Growth Factor Receptor 2 (HER2) status.
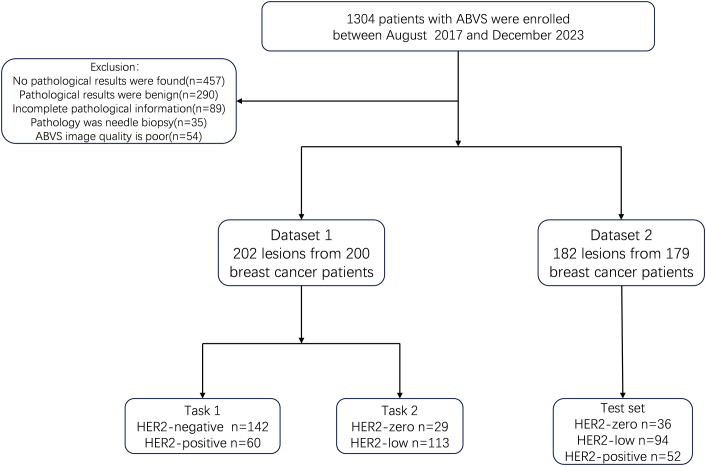
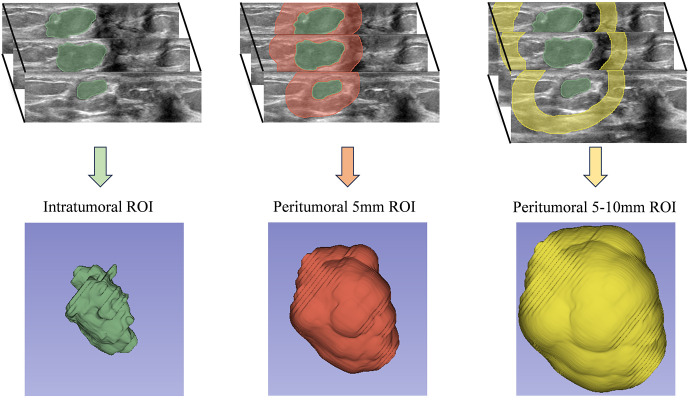
Methods: This retrospective study analyzed 384 lesions from 379 patients with pathologically confirmed breast cancer across four hospitals. Two tasks were defined: Task 1 to distinguish HER2-negative from HER2-positive cases and Task 2 to differentiate HER2-zero from HER2-low status. For each classification task, three models were built: Model 1 included radiomics features from the tumor region alone; Model 2 included features from both the tumor region and a 5mm peritumoral region; and Model 3 incorporated features from the tumor region, the 5mm peritumoral region, and the 5-10mm peritumoral region. The performance of the model was evaluated using receiver operating characteristic (ROC) curves, with key metrics including the area under the curve (AUC), sensitivity, specificity, and accuracy.
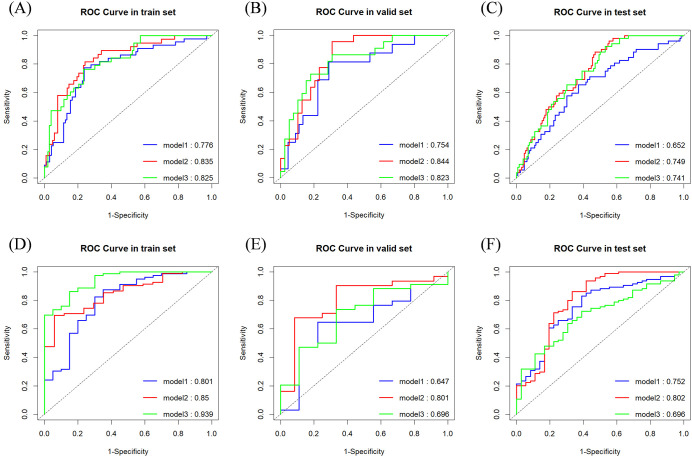
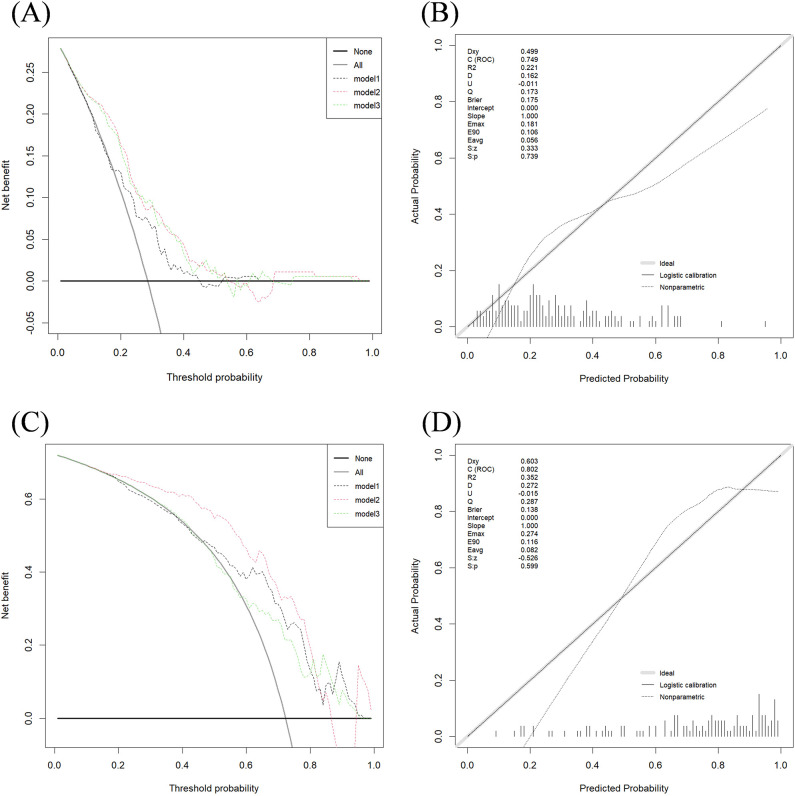
Results: In the classification tasks, Model 2 demonstrated superior predictive performance across multiple datasets. For Task 1, it achieved the highest AUC (0.844), exceptional sensitivity (0.955), and satisfactory accuracy (0.787) in the validation set, and outperformed other models in the test set with an AUC of 0.749 and sensitivity of 0.885, highlighting its robustness and clinical applicability. For Task 2, Model 2 exhibited the highest AUC (0.801), sensitivity (0.862), and accuracy (0.808) in the test set, with consistent performance across the training (AUC 0.850) and validation sets (AUC 0.801). Model 3, which combines intratumoral and peritumoral features, did not demonstrate significant improvements over the intratumoral-only model in the two classification tasks. These results underscore the value of incorporating peritumoral radiomics features, particularly within a 5mm margin, to enhance predictive performance compared to intratumoral-only models.
Conclusion: The radiomics model integrating intratumoral and appropriate peritumoral features significantly outperformed the model based on intratumoral features alone. This integrated approach holds strong potential for noninvasive, preoperative prediction of HER2 status.
Keywords: automated breast volume scanner; breast cancer; human epidermal growth factor receptor 2; peritumoral; radiomics.
Copyright © 2025 Zhang, Miao, Fu, Pan, Jin, Gu and Ni.
Conflict of interest statement
The authors declare that the research was conducted in the absence of any commercial or financial relationships that could be constructed as a potential conflict of interest.
Figures
References
-
- Zhang H, Ren G, Wang X, Zhao J, Yao H, Bai Y, et al. . Her-2 gene amplification by fluorescence in situ hybridization (Fish) compared with immunohistochemistry (Ihc) in breast cancer: A study of 528 equivocal cases. Breast Cancer Res Treat. (2012) 134:743–9. doi: 10.1007/s10549-012-2101-x - DOI - PubMed
-
- Goldhirsch A, Winer EP, Coates AS, Gelber RD, Piccart-Gebhart M, Thürlimann B, et al. . Personalizing the treatment of women with early breast cancer: highlights of the st gallen international expert consensus on the primary therapy of early breast cancer 2013. Ann Oncol. (2013) 24:2206–23. doi: 10.1093/annonc/mdt303 - DOI - PMC - PubMed
LinkOut - more resources
Full Text Sources
Research Materials
Miscellaneous