. 2025 Apr 16:16:1552563.
doi: 10.3389/fimmu.2025.1552563. eCollection 2025.

Assessing HIV-1 subtype C infection dynamics, therapeutic responses and reservoir distribution using a humanized mouse model

Affiliations

Assessing HIV-1 subtype C infection dynamics, therapeutic responses and reservoir distribution using a humanized mouse model

Snehal Kaginkar et al. Front Immunol. .

Abstract

Introduction: While HIV-1 subtype C (HIV-1C) is the most prevalent and widely distributed subtype in the HIV pandemic, nearly all current prevention and therapeutic strategies are based on work with the subtype B (HIV-1B). HIV-1C displays distinct genetic and pathogenic features from that of HIV-1B. Thus, treatment approaches developed for HIV-1B need to be suitably optimized for HIV-1C. A suitable animal model will help delineate comparative aspects of HIV-1C and HIV-1B infections.

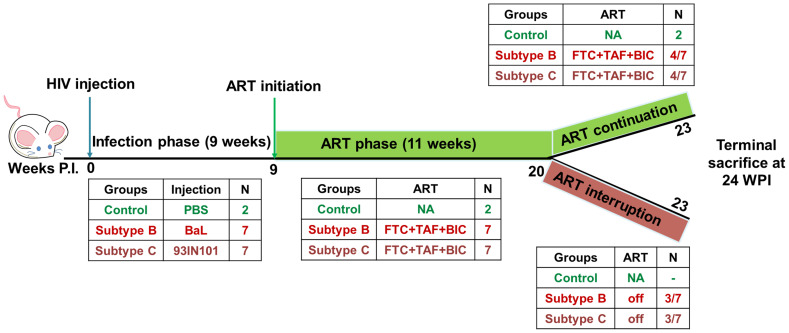
Methods: Here, we used a humanized mouse model to evaluate HIV-1C infection, disease progression, response to anti-retroviral therapy (ART) and viral rebound following therapy interruption. A limited comparative study with a prototypical subtype B virus was also performed. Viral infection, immune cell dynamics, acquisition of anti-retroviral therapy (ART) resistance and anatomical reservoir distribution following extended and interrupted therapy were compared.

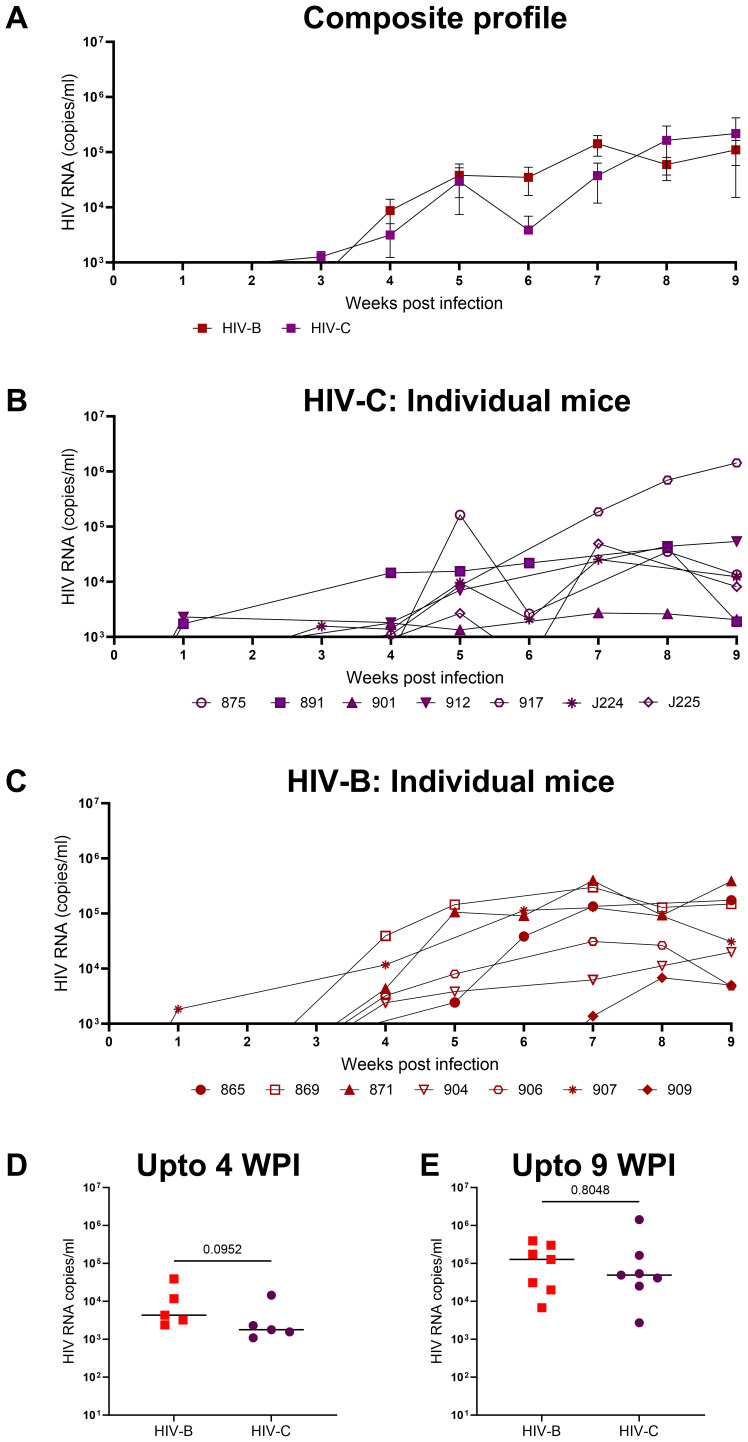
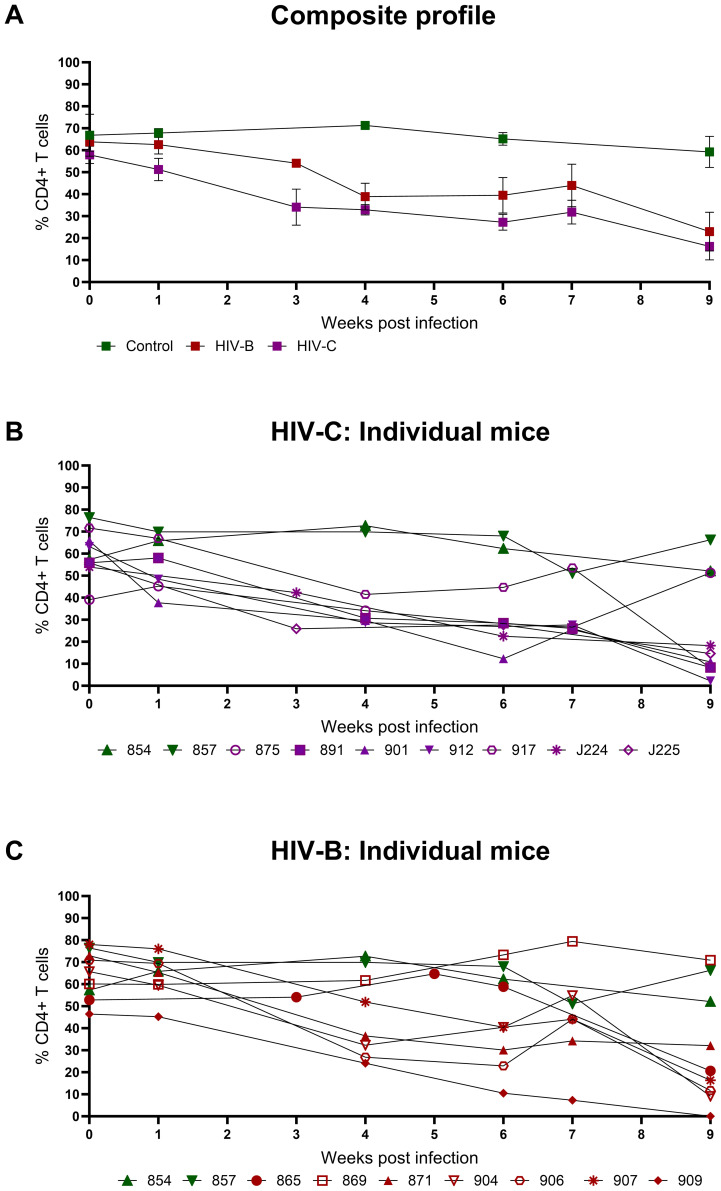
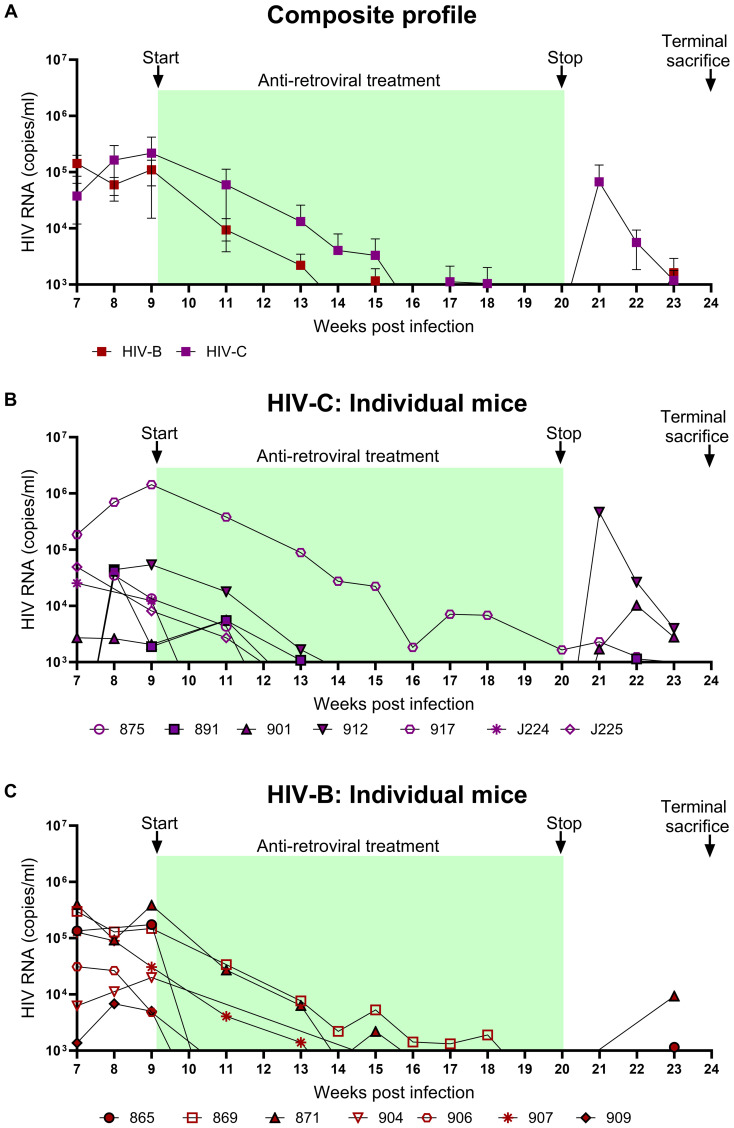
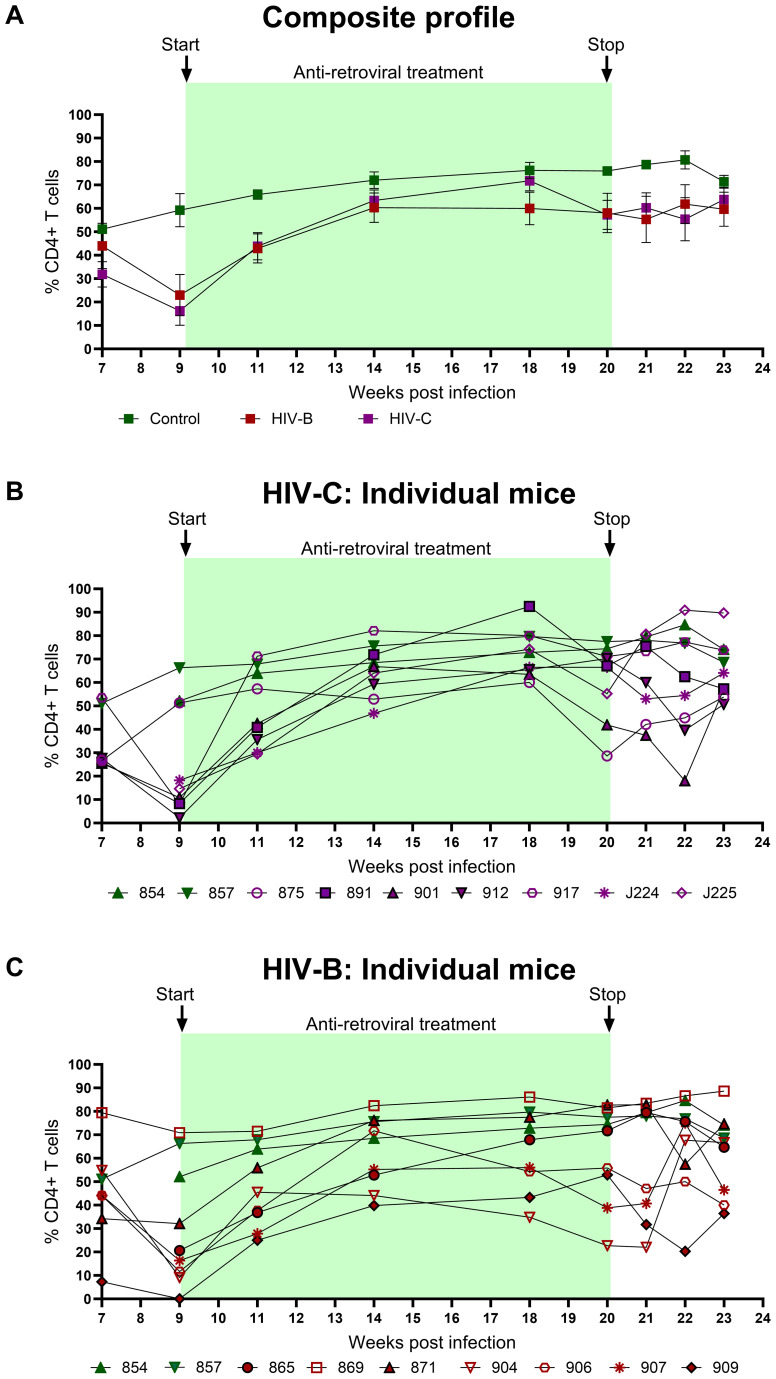
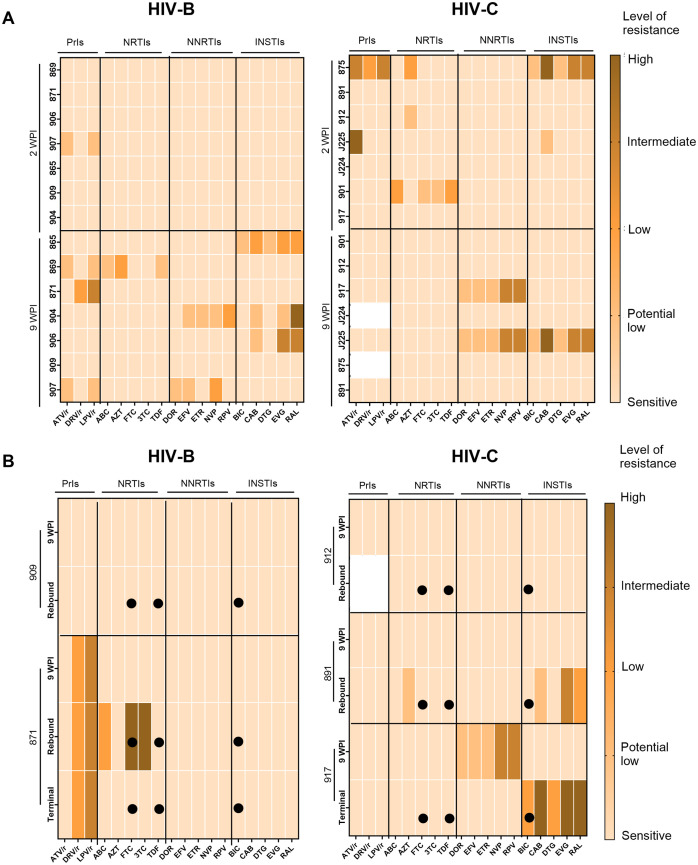
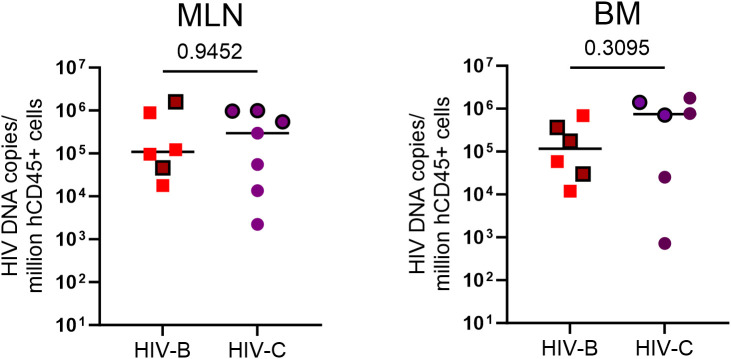
Results: In comparison, lower early plasma viremia was observed with HIV-1C, but with similar rate of CD4+ T cell depletion as that of HIV-1B. Viral suppression by ART was delayed in the HIV-1C infected group with evidence, in one case, of acquired class wide resistance to integrase inhibitors, a critical component of current global therapy regimens. Also, HIV-1C infected animals displayed faster rebound viremia following ART interruption (ATI). Disparate patterns of tissue proviral DNA distribution were observed following extended ART and ATI suggestive of distinct sources of viral rebound.

Discussion: In this preliminary study, discernible differences were noted between HIV-1C and B with implications for prevention, therapeutics and curative strategies. Results from here also highlight the utility of the hu-HSC mouse model for future expanded studies in this context.

Keywords: HIV subtype C infection dynamics in humanized mice; HIV-1C tissue reservoir; anti-retroviral therapy for HIV-1C; drug resistance mutations; humanized mice for HIV-1C; treatment interruption.


Conflict of interest statement

The authors declare that the research was conducted in the absence of any commercial or financial relationships that could be construed as a potential conflict of interest. The author(s) declared that they were an editorial board member of Frontiers, at the time of submission. This had no impact on the peer review process and the final decision.

Figures

Figure 1
Figure 1
Schematics of experimental design: HIV infection was monitored in hu-mice for a total of 23 weeks. Hu-mice were classified into 3 groups. Uninfected (control, n=2), subtype B infected (HIV-B, n=7), subtype C infected (HIV-C, n=7). The study was divided in 3 phases. In the pre- anti-retroviral therapy phase (ART), up to 9 weeks post infection (WPI) was allowed to occur in the absence of ART. ART phase was initiated at week 9 in viremic mice and continued for 11 weeks i.e. 20 WPI. After ART phase, animals were divided into two study arms. In the ART continuation arm, 4 mice from HIV-B and HIV-C each were continued on ART for a further three weeks. In the second arm, the ART interruption arm, 3 mice from HIV-B and HIV-C each, were released from ART and monitored for viral rebound for 3 weeks. The study was terminated for all animals at 24 WPI.
Figure 2
Figure 2
Productive and persistent infection of hu-mice by HIV-1C: Hu-mice were infected i/p with either HIV-1C or HIV-1B and plasma viral loads were assessed by qRT-PCR on a weekly basis. (A) Composite weekly viral load profiles of HIV-1C infected group (HIV-C, purple) and HIV-1B infected group (HIV-B, red) shown as mean ± SEM. (B) Plasma viremia profile of individual mice from HIV-C group, n=7 and (C) individual mice from HIV-B group, n=7. (D) Comparison of HIV-C and HIV-B peak viral loads up to 4 WPI and (E) from 5-9 WPI respectively done using Mann-Whitney test (p=0.09 and p=0.80 respectively). Horizontal bar shows the median.
Figure 3
Figure 3
Peripheral CD4+ T cell levels during HIV-1C and HIV-1B infection of hu-mice: Infected mice were bled weekly and CD4+ T cell levels were assayed by flow cytometry. (A) Composite weekly CD4+ T cell levels in the HIV-1C infected group (HIV-C, purple) and the HIV-1B infected group (HIV-B, red) along with the uninfected group (control, green), shown as mean ± SEM were compared using the Kruskal- Wallis test (B) CD4+ T cell levels of individual mice from the HIV-C group (n=7) and (C) Individual mice from the HIV-B group, (n=7) along with control animals (n=2).
Figure 4
Figure 4
Viral suppression during ART and viral rebound kinetics following treatment interruption: After confirming chronic viremia, ART was commenced at week 9 and continued for 11 weeks. For treatment interruption, ART was discontinued in 3 mice from each group for 3 weeks prior to sacrifice of all mice. Plasma viral loads were determined by qRT-PCR on a weekly basis. (A) Composite weekly viral load profiles of HIV-C (purple) and HIV-B (red) infected groups shown as mean ± SEM. (B) Plasma viremia profile of individual mice from the HIV-C group (n=7) and (C) individual mice from HIV-B group (n=7). Green shaded areas represent duration of ART treatment. At 20 WPI, 3 mice from each of the HIV-B and HIV-C groups were released from therapy (represented as closed symbols with black border) and their viral loads were monitored until 23 WPI. Study was terminated with sacrifice at 24 WPI of all animals, including those continued on ART from 9 WPI.
Figure 5
Figure 5
Peripheral CD4+ T cell profiles during ART and treatment interruption: CD4+ T cell levels were assessed by flow cytometry on a weekly basis. (A) Composite CD4+ T cell profiles of uninfected control (green), HIV-B group (red) and HIV-C group (purple). Intergroup comparison was done using the Kruskal- Wallis test. (B) Frequency of CD4+ T cells in individual mice from HIV-C group (n=7) and (C) individual mice HIV-B group (n=7) along with control animals.
Figure 6
Figure 6
Assessment of drug resistance mutations in circulating viruses during pre-treatment and post-ART. Colour key indicates level of resistance with lighter to darker shades representing sensitive (no resistance), potential low level, low level, intermediate level and high level of resistance. (A) Heatmap of pol sequences indicating presence and level of DRM conferred resistance to classes of antiretroviral Protease Inhibitors (PrIs), Nucleoside Reverse Transcriptase inhibitors (NRTIs), Non-Nucleotide Reverse Transcriptase Inhibitors (NNRTIs) and Integrase Strand Transfer Inhibitors (INSTIs) with drugs on the X axis and animal IDs on the Y axis during infection phase (B) Heatmaps of longitudinally sampled animals from HIV-B (909 and 871) and HIV-C (912 and 891) groups in treatment release arm, and HIV-C animal 917 that received uninterrupted therapy. For each animal, ART drugs are listed on the X-axis and time points for DRM analysis are shown on the Y-axis along with animal IDs. Solid circles indicate the drugs administered during therapy.
Figure 7
Figure 7
HIV proviral DNA distribution in tissues: Terminal tissue collection samples were analyzed by PCR to measure proviral loads. From left to right, HIV proviral burden in mesenteric lymph nodes (MLN) and bone marrow (BM). Values expressed as proviral copies per million hCD45+ cells. HIV DNA proviral copies were compared using the Mann-Whitney test group wise comparison of all animals. Horizontal bar shows the median. Symbols with black borders indicate treatment interrupted animals in both the groups.

Similar articles

References

    1. Nair M, Gettins L, Fuller M, Kirtley S, Hemelaar J. Global and regional genetic diversity of HIV-1 in 2010–21: systematic review and analysis of prevalence. Lancet Microbe. (2024) 5(11):10091. doi: 10.1016/S2666-5247(24)00151-4 - DOI - PubMed
    1. Abraha A, Nankya IL, Gibson R, Demers K, Tebit DM, Johnston E, et al. . CCR5- and CXCR4-tropic subtype C human immunodeficiency virus type 1 isolates have a lower level of pathogenic fitness than other dominant group M subtypes: implications for the epidemic. J Virol. (2009) 83:5592–605. doi: 10.1128/JVI.02051-08 - DOI - PMC - PubMed
    1. Kiguoya MW, Mann JK, Chopera D, Gounder K, Lee GQ, Hunt PW, et al. . Subtype-specific differences in gag-protease-driven replication capacity are consistent with intersubtype differences in HIV-1 disease progression. J Virol. (2017) 91. doi: 10.1128/JVI.00253-17 - DOI - PMC - PubMed
    1. Omondi FH, Chandrarathna S, Mujib S, Brumme CJ, Jin SW, Sudderuddin H, et al. . HIV subtype and nef-mediated immune evasion function correlate with viral reservoir size in early-treated individuals. J Virol. (2019) 93. doi: 10.1128/JVI.01832-18 - DOI - PMC - PubMed
    1. Pal S, Jaiswal V, Nala N, Ranga U. Enhanced transcriptional strength of HIV-1 subtype C minimizes gene expression noise and confers stability to the viral latent state. J Virol. (2023) 97. doi: 10.1128/jvi.01376-22 - DOI - PMC - PubMed

Substances