. 2024;33(2):216-236.
doi: 10.1007/s13562-024-00886-0. Epub 2024 May 9.

Genomic prediction and QTL analysis for grain Zn content and yield in Aus-derived rice populations

Affiliations

Genomic prediction and QTL analysis for grain Zn content and yield in Aus-derived rice populations

Tapas Kumer Hore et al. J Plant Biochem Biotechnol. 2024.

Abstract

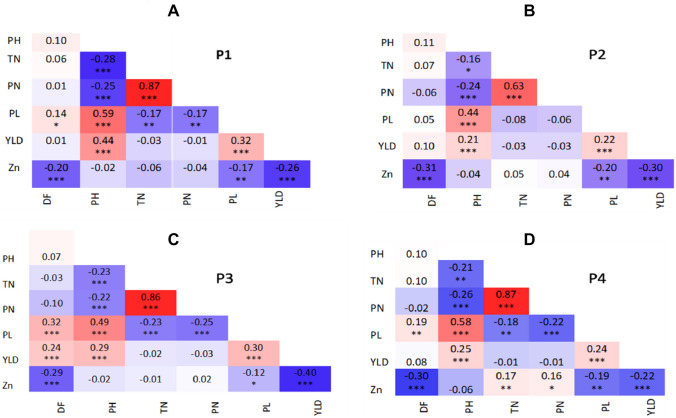
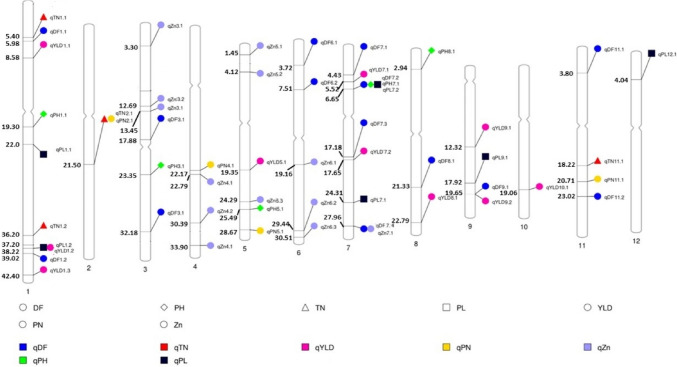
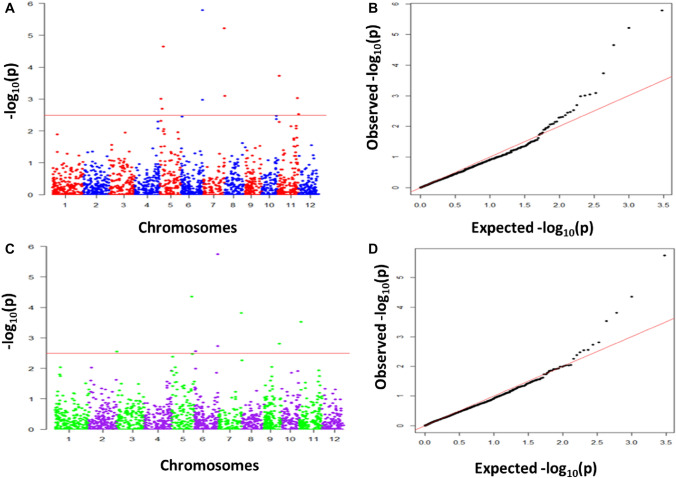
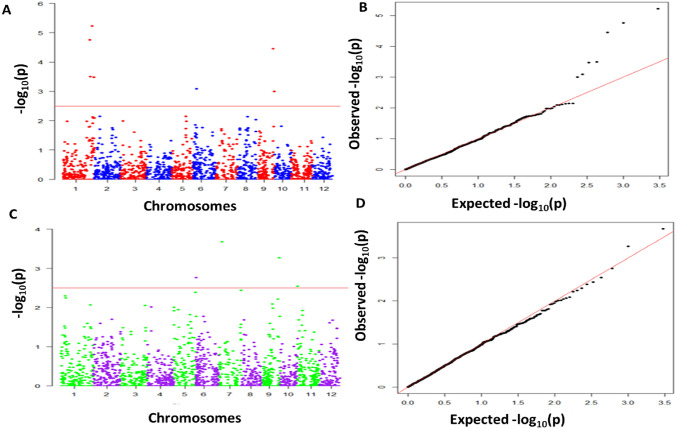
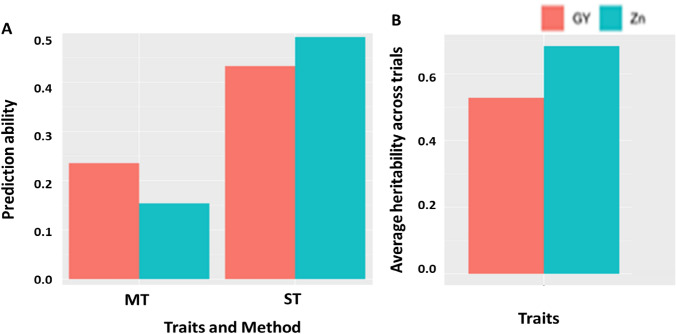
Zinc (Zn) biofortification of rice can address Zn malnutrition in Asia. Identification and introgression of QTLs for grain Zn content and yield (YLD) can improve the efficiency of rice Zn biofortification. In four rice populations we detected 56 QTLs for seven traits by inclusive composite interval mapping (ICIM), and 16 QTLs for two traits (YLD and Zn) by association mapping. The phenotypic variance (PV) varied from 4.5% (qPN 4.1 ) to 31.7% (qPH 1.1 ). qDF 1.1 , qDF 7.2 , qDF 8.1 , qPH 1.1 , qPH 7.1 , qPL 1.2 , qPL 9.1, qZn 5.1 , qZn 5.2 , qZn 6.1 and qZn 7.1 were identified in both dry and wet seasons; qZn 5.1 , qZn 5.2 , qZn 5.3, qZn 6.2, qZn 7.1 and qYLD 1.2 were detected by both ICIM and association mapping. qZn 7.1 had the highest PV (17.8%) and additive effect (2.5 ppm). Epistasis and QTL co-locations were also observed for different traits. The multi-trait genomic prediction values were 0.24 and 0.16 for YLD and Zn respectively. qZn 6.2 was co-located with a gene (OsHMA2) involved in Zn transport. These results are useful for Zn biofortificatiton of rice.

Supplementary information: The online version contains supplementary material available at 10.1007/s13562-024-00886-0.

Keywords: GWAS; Genes; QTL; RIL; Rice; Yield; Zn.


Conflict of interest statement

Conflict of interestThe authors have no relevant financial or non-financial competing interests.

Figures

Fig. 1
Fig. 1
Correlations among agronomic traits, yield, and grain Zn in four RIL populations. Corrleation for each population was estimated using R-Program. Postitive correlations are indicated by red color, while negative correlations are indicated by blue color. Darker colors correspond to stronger correlation coefficients. AD indicates correlations for four populations P1–P4; DF, days to flowering (days); PH, plant height (cm); TN, tiller number; PN, panicle number; PL, panicle length (cm); YLD, yield (ton/ha); Zn, zinc (ppm). *p < 0.05, **p < 0.01, ***p < 0.001 (color figure online)
Fig. 2
Fig. 2
Principal component analysis of all four RIL populations using the two PCs with the highest proportion of variance. PCA for each population was estimated using R-Program. A-D indicates PCA for four populations P1–P4; The variable factor map is obtained from the PCA on agronomic traits, yield and Zn. A small angle between variables implies positive correlation, a large one suggests negative correlation, and a 90-degree angle indicates no correlation between two traits. Dim1 corresponds to PC1, and Dim2 corresponds to PC2; variables with a high contribution to the dataset variance are in red/orange whereas variable with low contribution are in blue. DF, days to flowering (days); PH, plant height (cm); TN, tiller number; PN, panicle number; PL, panicle length (cm); YLD, yield (ton/ha); Zn, zinc (ppm) (color figure online)
Fig. 3
Fig. 3
Distribution of QTLs mapped for agronomic traits, yield, and grain Zn content on all 12 chromosomes in all four populations. SNP markers were mapped to the chromosome to represent the QTLs’ physical locations (Mb). The physical position of each SNP marker was shown on the left side, with the corresponding agronomic traits, yield, and Zn displayed on the right side. QTLs of different types of traits were distinguished by different colors: blue for DF (Days to flowering), green for PH (Plant height in cm), red for TN (Tiller number), yellow for PN (Panicle number), black for PL (Panicle length in cm), pink for YLD (Yield in ton/ha), and purple for Zn (Zinc in ppm) (color figure online)
Fig. 4
Fig. 4
Genome-wide association analysis of grain Zn using Compressed Mixed Linear Model (CMLM) in GAPIT v3. Manhattan plots on the right display associated significant SNP markers for grain Zn detected during the 2019 wet season (A) and the 2020 dry season (B), with quantile–quantile plots for each season on the left. The X-axis represents chromosome numbers, and Y-axis represents − log 10 (p). The horizontal red line indicates the threshold p-value at significant level (p < 0.0001) (color figure online)
Fig. 5
Fig. 5
Genome-wide association analysis of YLD using Compressed Mixed Linear Model (CMLM) in GAPIT v3. Manhattan plots on the right display associated significant SNP markers for YLD detected during the 2019 wet season (A) and the 2020 dry season (B), with quantile–quantile plots for each season on the left. The X-axis represents chromosome numbers, and Y-axis represents − log 10 (p). The horizontal red line indicates the threshold p-value at significant level (p < 0.0001) (color figure online)
Fig. 6
Fig. 6
HyperTree depicting co-network analysis of predicted candidate gene LOC_Os06g0700700. The figure shows various coexpressed genes associated with LOC_Os06g0700700 in a HyperTree format using RiceFREND. Transcription factor encoding genes are represented as orange square boxes, and the candidate gene LOC_Os06g0700700 is highlighted at the center of the circular HyperTree
Fig. 7
Fig. 7
Graphical depiction of prediction accuracy and heritability. Genomic prediction was estimated through single-trait (YLD/Zn individually) and multi-trait (YLD and Zn combined) strategies for all populations. MT, multi-trait; ST, single trait, Linear mixed models were implemented via ASReml-R (Analysis Software for Residual Maximum Likelihood following a CV-alpha) using a cross-validation system with four replicates and 5-folds. Deregressed Best Linear Unbiased Predictors (dBLUPs) were utilized as the response variable for each trait

Similar articles

References

    1. Aggett PJ (2020) Chapter 22: Iron. In: Marriott BP, Birt DF, Stallings VA, Yates AABT (eds) Present knowledge in nutrition, 11th edn. Academic Press, London, pp 375–392
    1. Arfi N, Khatoon K, Alim F (2022) Zinc malnutrition in children and its consequences on health. In: Tabrez S, Khan AM (eds) Microbial biofertilizers and micronutrient availability: the role of zinc in agriculture and human health. Springer, Cham, pp 35–67. 10.1007/978-3-030-76609-2_2
    1. Arojju SK, Cao M, Trolove M, Barrett BA, Inch C, Eady C, Stewart A, Faville MJ (2020) Multi-trait genomic prediction improves predictive ability for dry matter yield and water-soluble carbohydrates in perennial ryegrass. Front Plant Sci 11:1197. 10.3389/fpls.2020.01197 - PMC - PubMed
    1. Ata-Ul-Karim ST, Begum H, Lopena V, Borromeo T, Virk P, Hernandez JE, Gregorio GB, Collard BCY, Kato Y (2022) Genotypic variation of yield-related traits in an irrigated rice breeding program for tropical Asia. Crop Environ 1(3):173–181. 10.1016/j.crope.2022.08.004
    1. Babu PM, Neeraja CN, Rathod S, Suman K, Uttam GA, Chakravartty N, Lachagari VBR, Chaitanya U, Rao LVS, Voleti SR (2020) Stable SNP allele associations with high grain zinc content in polished rice (Oryza sativa L.) identified based on ddRAD sequencing. Front Genet 11(August):1–18. 10.3389/fgene.2020.00763 - PMC - PubMed

LinkOut - more resources