. 2025 Apr 24;16(21):9413-9423.
doi: 10.1039/d5sc01488c. eCollection 2025 May 28.

Tandem reaction-powered near-infrared fluorescent molecular reporter for real-time imaging of lung diseases

Affiliations

Tandem reaction-powered near-infrared fluorescent molecular reporter for real-time imaging of lung diseases

Yan Hu et al. Chem Sci. .

Abstract

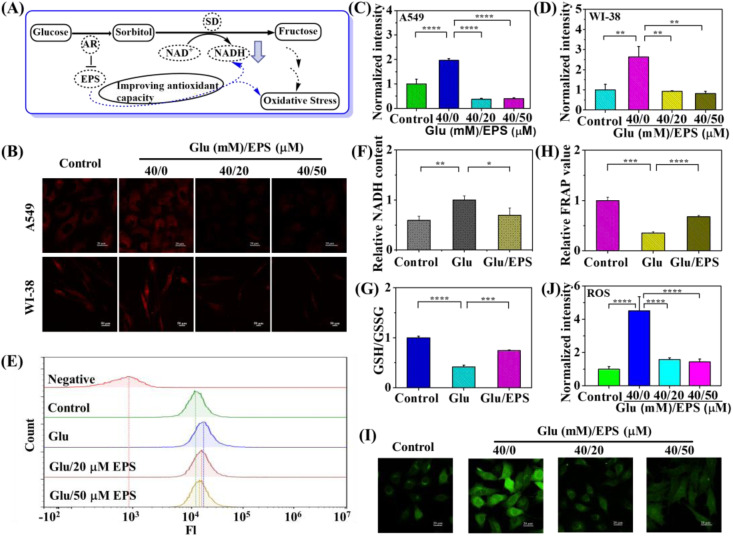
Diabetes and its complications have drawn growing research attention due to their detrimental effects on human health. Although optical probes have been used to help understand many aspects of diabetes, the lung diseases caused by diabetes remain unclear and have rarely been explored. Herein, a tandem-reaction (TR) strategy is proposed based on the adjacent diol esterification-crosslinking reaction and the nicotinamide reduction reaction of nicotinamide adenine dinucleotide (NADH) to design a lung-targeting near-infrared (NIR) small molecule probe (NBON) for accurate imaging of diabetic lung diseases. NBON was designed by coupling a phenylboronic acid analog that can form borate ester bonds by reversibly binding with NADH via an esterification-crosslinking reaction. Streptozotocin (STZ)-induced diabetic mice and metformin (MET)/epalrestat (EPS)-repaired model studies demonstrated that NBON allowed the sensitive imaging of NADH for lung disease diagnosis and therapeutic monitoring. The proposed antioxidant mechanism by which EPS alleviates diabetic lung disease was studied for the first time in living cells and in vivo. Furthermore, NBON was successfully applied in the detection of NADH in tumors and lung metastases. Overall, this work provides a general platform for a NIR NADH probe design, and advances the development of NADH probes for mechanistic studies in lung diseases.


Conflict of interest statement

There are no conflicts to declare.

Figures

Scheme 1
Scheme 1. (A) Traditional “reaction type” probes for NADH from previous work. (B) Our “tandem-reaction” type probes for NADH in this work. (C) Design and structure of compounds NBON/NCCN and the proposed mechanism of NBON for imaging NADH in diabetic lung diseases.
Fig. 1
Fig. 1. (A) Fluorescence emission spectra of NBON (5 μM) with concentration of NADH (0–1 μM). (B) Linear correlation between the fluorescence intensity of NBON (5 μM) and NADH concentration. (C) Fluorescence emission spectra of NCCN (5 μM) with concentration of NADH (0–1 μM). (D) Fluorescence emission spectra of NCCN (5 μM) with concentration of NADH (0–100 μM). (E) Linear correlation between the fluorescence emission intensity of NCCN (5 μM) and NADH concentration. (F) Fluorescence emission spectra of NBON (5 μM) with concentration of NADH (0–100 μM). (G) Normalized absorption spectra of NBON (5 μM) in the presence of NADH (70 μM). (H) The time-dependent fluorescence intensity of NBON (5 μM) with NADH. (I) Fluorescence intensities of NBON to various analytes (2–7, 1 mM; 8–13, 100 μM; 14–15, 70 μM).
Fig. 2
Fig. 2. (A) Fluorescence images of endogenous NADH in A549 cells incubated with NBON (15 μM) within 60 min. (B) Fluorescence images of exogenous NADH in A549 cells incubated with different concentration NADH (0–3000 μM) for 2 h, then incubated with NBON (15 μM) for 40 min. (C) Average fluorescence intensity in (B) (n = 4, data expressed as mean ± SD, **P < 0.01, ***P < 0.001, and ****P < 0.0001, Student's t-test). Scale bar = 20 μm. (D) Intracellular localization of NBON in A549 cells using MitoTracker Green and LysoTracker Green. Scale bar: 10 μm.
Fig. 3
Fig. 3. (A) Fluorescence images of NADH in A549 cells treated with only probe NBON (15 μM) or pretreated with LA/Py (20/0, 0/10 and 0/20 mM) for 30 min. Scale bar: 20 μm. (B) Relative fluorescence intensity in (A). (C) Fluorescence images of NADH in A549 and WI-38 cells treated with only probe NBON (15 μM) or pretreated with glucose (5, 20 and 30 mM) for 12 h. (D and E) Relative fluorescence intensity in (C) for A549 cells (D) and for WI-38 cells (E). (n ≥ 3, data expressed as mean ± SD, *P < 0.05, ***P < 0.001 and ****P < 0.0001, Student's t-test). Scale bar: 20 μm for A549 cells and 50 μm for WI-38 cells.
Fig. 4
Fig. 4. (A) The proposed mechanistic pathway of EPS for relieving diabetic lung diseases. (B) Fluorescence images of NADH in A549 and WI-38 cells treated with only NBON (15 μM) or incubated with EPS (0, 20 and 50 μM) for 24 h before glucose stimulation (40 mM) for 12 h. Scale bar: 20 μm for A549 cells and 50 μm for WI-38 cells. (C and D) Relative fluorescence intensity in B for A549 and WI-38 cells. (E) Flow cytometric analysis of intact cells-loaded NBON incubated with glucose/epalrestat (40 mM/0 μM, 40 mM/20 μM and 40 mM/50 μM). (F) Measurement of NADH from cells incubated with glucose/epalrestat (40 mM/0 μM and 40 mM/50 μM). (G) Measurement of GSH/GSSG from cells incubated with glucose/epalrestat (40 mM/0 μM and 40 mM/50 μM). (H) Measurement of FRAP value from cells incubated with glucose/epalrestat (40 mM/0 μM and 40 mM/50 μM). (I) Fluorescence images of ROS in A549 treated with only commercial probe DCFH-DA (20 μM) or incubated with EPS (0, 20 and 50 μM) for 24 h before glucose stimulation (40 mM) for 12 h. Scale bar = 20 μm. (J) Relative fluorescence intensity in I. (n ≥ 3, data expressed as mean ± SD, *P < 0.05, **P < 0.01, ***P < 0.001, and ****P < 0.0001, Student's t-test).
Fig. 5
Fig. 5. Fluorescence images of compounds NBCS (A) and CS (B) in mice (intravenous injection, 60 μL, 200 μM, 90 min) and ex vivo. (1) Heart; (2) liver; (3) spleen; (4) lung; (5) kidney. (C) Schematic representation for constructing diabetic lung disease model and imaging. (D) Real-time imaging of Kunming mice with different treatment by receiving injection of PBS, STZ (150 mg kg−1, intraperitoneal), STZ/MET (150/200 mg kg−1, intraperitoneal) and STZ/EPS (150/100 mg kg−1, intraperitoneal/gavage), followed by intravenously injecting NBON (60 μL, 200 μM). (E) Relative fluorescence intensity in D. (F) Measurement of NAD+/NADH ratio and (G) FRAP value of lung tissues from mice treated with STZ (150 mg kg−1), STZ/MET (150/200 mg kg−1) and STZ/EPS (150/100 mg kg−1). (H) Hematoxylin and eosin (H&E) staining of lung tissues from mice treated with STZ (150 mg kg−1), STZ/MET (150/200 mg kg−1) and STZ/EPS (150/100 mg kg−1). Scale bar: 50 μm. (I) Normalized intensity for the lung incubated with NBON from mice treated with STZ (150 mg kg−1), STZ/MET (150/200 mg kg−1) and STZ/EPS (150/100 mg kg−1). (n = 3, data expressed as mean ± SD, *P < 0.05, **P < 0.01, ***P < 0.001, and ****P < 0.0001, Student's t-test).
Fig. 6
Fig. 6. (A) Schematic representation for lung metastatic tumor model and imaging. (B) Imaging of normal lung (first row) and lung metastatic tumor (second row) through intravenously injecting NBON (100 μL, 200 μM) in BALB/c mice. White oval: lung. (a and e) Injecting intravenously NBON for 25 min, then fluorescence image; (b and f) injecting intravenously NBON for 120 min, then fluorescence image; (c and g) bright image (up: normal lung; down: lung metastasis); (d and h) dissection lung tissues from BALB/c mice after injecting intravenously NBON for 130 min. (C) Hematoxylin and eosin (H&E) staining of normal lung and lung metastasis from mice. Scale bar: 50 μm. (D) Fluorescence-guided resection and imaging of lung tumor through spraying PBS and NBON (30 μL, 100 μM) in BALB/c mice. 1 and 2: lung tumor for PBS (1) and NBON (2). (E) Imaging of lung tumor and para-carcinoma tissues through spraying NBON (10 μL, 500 μM) ex vivo. (F) Relative intensity in (E). (n = 3, data expressed as mean ± SD, ***P < 0.001, Student's t-test).

Similar articles

References

    1. Brownlee M. Nature. 2001;414:813–820. doi: 10.1038/414813a. - DOI - PubMed
    1. Amanat S. Ghahri S. Dianatinasab A. Fararouei M. Dianatinasab M. Adv. Exp. Med. Biol. 2020;1228:91–105. doi: 10.1007/978-981-15-1792-1_6. - DOI - PubMed
    1. Cho N. H. Shaw J. E. Karuranga S. Huang Y. da Rocha Fernandes J. D. Ohlrogge A. W. Malanda B. Diabetes Res. Clin. Pract. 2018;138:271–281. doi: 10.1016/j.diabres.2018.02.023. - DOI - PubMed
    1. Schuyler M. R. Niewoehner D. E. Inkley S. R. Kohn R. Am. Rev. Respir. Dis. 1976;113:37–41. - PubMed
    1. Pitocco D. Fuso L. Conte E. G. Zaccardi F. Condoluci C. Scavone G. Incalzi R. A. Ghirlanda G. Rev. Diabet. Stud. 2012;9:23–35. doi: 10.1900/RDS.2012.9.23. - DOI - PMC - PubMed

LinkOut - more resources