. 2025 May 1;135(9):e184431.
doi: 10.1172/JCI184431.

Inborn errors of immunity underlie clonal T cell expansions in large granular lymphocyte leukemia

Affiliations

Inborn errors of immunity underlie clonal T cell expansions in large granular lymphocyte leukemia

Carlos Bravo-Perez et al. J Clin Invest. .

Abstract

BACKGROUNDT cell large granular lymphocyte leukemia (T-LGLL) is a lymphoproliferative disorder of cytotoxic T lymphocytes (CTLs), often with gain-of-function STAT3 mutations. T-LGLL represents a unique model for the study of persistent CTL expansions. Albeit autoimmunity is implied, various paradoxical observations led us to investigate whether immunodeficiency traits underpin T-LGLL.METHODSThis is a comprehensive immunogenomic study of 92 consecutive patients from a large T-LGLL cohort with full laboratory-clinical characterization (n = 271). Whole-exome profiling of variants associated with inborn errors of immunity (IEI) and somatic mutations in T cell lymphoid drivers was analyzed. Single-cell RNA-Seq and TCR-Seq in T-LGLL samples and RNA-Seq in T cell cancer cell lines were utilized to establish biological correlations.RESULTSLymphocytopenia and/or hypogammaglobulinemia were identified in 186 of 241 (77%) T-LGLL patients. Genetic screening for IEI revealed 43 rare heterozygous variants in 38 different immune genes in 34 of 92 (36%) patients (vs. 167/63,026 [0.26%] in controls). High-confidence deleterious variants associated with dominant, adult-onset IEIs were detected in 15 of 92 (16%) patients. Carriers showed atypical features otherwise tied to the cryptic IEI, such as earlier onset, lower lymphocyte counts, lower STAT3 mutational rate, and higher proportions of hypogammaglobulinemia and immune cytopenia/bone marrow failure than noncarriers. Somatic mutational landscape, RNA-Seq, and TCR-Seq analyses supported immune imbalance caused by the IEI variants and interactions with somatic mutations in T cell lymphoid drivers.CONCLUSIONSOur findings in T-LGLL reveal that maladaptive CTL expansions may stem from cryptic immunodeficiency traits and open the horizon of IEIs to clonal hematopoiesis and bone marrow failure.FUNDINGNIH; Aplastic Anemia and MDS International Foundation; VeloSano; Edward P. Evans Foundation; Instituto de Salud Carlos III; European Research Council; European Research Area Network on Personalised Medicine; Academy Finland; Cancer Foundation Finland.

Keywords: Adaptive immunity; Genetics; Hematology; Lymphomas; Molecular genetics.


Conflict of interest statement

Conflict of interest: The authors have declared that no conflict of interest exists.

Figures

Figure 1
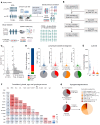
Figure 1. Study summary and systematic characterization of immunodeficiency underpinnings of T-LGLL.
(A) Graphic summary of study design, study cohort, and study datasets (created with Biorender.com). (B) Flow chart of the initial immunologic laboratory characterization. (C) Distribution dot plot of cohort absolute lymphocyte count (ALC) (available in n = 241 patients). Dashed lines represent the lower and upper limits of the normal range. The histogram represents the number of cases within ALC ranges. (D) Lymphocyte populations in peripheral blood at diagnosis (available in n = 216 patients). The bar chart represents the mean percentages of lymphocyte populations (CD8+ T cells, CD4+ T cells, NK and B cells). Distribution dot plots of each lymphocyte subset are also shown. Dashed lines represent the lower and upper limits of the normal range. The pie charts highlight the cases with low CD8+ T cells, low CD4+ T cells, low NK cells, and low B cells. (E) Concentration of Ig isotypes (IgG, IgA, IgM) at diagnosis (available in n = 201 patients). (F) Correlogram showing the association of Ig levels with age, blood counts, and lymphocytes. Spearman’s rho correlation coefficients and P values are shown for each pair of variables. Color scale represents the magnitude of the correlation coefficient. (G) Screening for potential causes of Ig hypogammaglobulinemia, detected in n = 64 patients at diagnosis. Anti-B, anti–B cell therapy; BCD, B cell dyscrasia; CBC, complete blood count; Chemo, chemotherapy; IST, immunosuppressive therapy; LGL, large granular lymphocyte count; WBC, white blood cell count; MN, myeloid neoplasms.
Figure 2
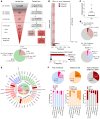
Figure 2. Immunogenomic landscape of variants predisposing to IEI in patients with T-LGLL.
(A) Variant and patient flow. Variants of potential clinical relevance included in the analysis (P/LP/VUS*) are highlighted with a dashed box. The pie chart at the bottom indicates the distribution of the variants by pathogenicity (ACMG criteria). (B) Comparison of the observed (Obs.) versus expected (exp.) (gnomAD) allele frequencies for the selection of variants overrepresented in our cohort (P/LP/VUS*). Multiple testing correction was done with Benjamini-Hodgberg method (FDR < 0.05). The bar chart at the bottom represents the combined mutational burden of all P/LP/VUS* observed in our cohort (39% vs. 0.26%, as compared with All of US healthy controls with genomic data, n = 63,026). χ2 P values are shown. The expected probability of finding any of the variants in the general population according to gnomAD is also shown (0.22%). (C) Individual mutation burden among carriers. All variants were found in the heterozygous state. (D) Number of patients carrying the variants according to pathogenicity (upper chart) and pattern of inheritance (lower chart). (E) Circle plot representing the number of variants by gene according to functional clustering and pathogenicity. Maroon bars indicate P/LP and genetic diagnoses of IEI, respectively. (F) Proportion of variants found according to functionality and pathogenicity, trait inheritance, and disease onset. χ2 P values are shown. ***P < 0.001. AD, autosomal dominant; AR, autosomal recessive; B/LB, benign/likely benign; Gen. Dx, genetic diagnosis; GL, germline; VUS*, VUS overrepresented in our cohort.
Figure 3
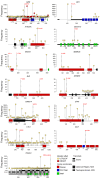
Figure 3. Mutations in 13 IEI genes with hcD variants identified in T-LGLL patients.
Annotation of the domains of the proteins coded by the canonical transcripts was extracted from Ensembl and UniProt.json files. For TCIRG1, exon-protein correlations for both the canonical and alternative transcripts are shown. The mutations labeled in red with the amino acid change are the ones found in our study. The plot additionally displays rare (MAF < 1%) deleterious variants previously reported in these genes using gnomAD genomic browser, version 4.1.0, integrating pathogenicity predictors and variant frequency (number of variants reported in gnomAD). LOF/pLOF, loss of function/predicted LOF; NOS, region/domain not otherwise specified.
Figure 4
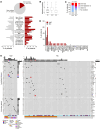
Figure 4. Clinical, laboratory, and genetic characterization of patients with hcD IEI variants.
(A) Clinical and laboratory features of the carriers of hcD variants (hcD, red) versus noncarriers (NC, gray). Family history (FHx) designates positive family history for immune or hemato-lymphoid conditions. The category immune cytopenia includes both BMF (i.e., aplastic anemia or PRCA) and antibody-mediated peripheral autoimmune cytopenias (Ab-mediated autoimmune cytopenia, i.e., autoimmune hemolytic anemia, autoimmune neutropenia, or immune thrombocytopenia). (B) Mutational burden (mutations/patient). (C) Mutational configuration in STAT3 and other T cell lymphoid driver genes. (D) Frequency (%) of mutations in individual T cell lymphoid driver genes. (E) Mutational profile in carriers and noncarriers of hcD variants. The upper plot represents somatic mutations in T cell lymphoid driver genes. The lower plot shows the germline hcD variants in IEI-linked genes, clustered by immune pathways. The specific mutated IEI gene is detailed for each case. The low-frequency, hypomorphic PRF1 variant identified in P49 is also shown. Main clinical features and color legends are indicated below. χ2 P values are shown. *P < 0.05; **P < 0.01; ***P < 0.001. Ab-mediated AIC, antibody-mediated peripheral autoimmune cytopenia; ANC, absolute neutrophil count; FHx, family history of immune/hemato-lymphoid conditions; ORR, overall response rate; y.o., years old.
Figure 5
Figure 5. Single-cell RNA+TCRαβ expression analysis of TCR signaling genes in STAT3mt and STAT3wt cells from T-LGLL samples and healthy controls.
(A) UMAP representation of the reclustered hyperexpanded T cells (>10 templates) annotated by cell phenotype and STAT3mt status. (B) TCR signalosome score in STAT3mt versus STAT3wt cells. The violin and ridge plots show the TCR score in STAT3mt and STAT3wt T-LGLL clones and in healthy control hyperexpanded T cells. Wilcoxon’s test P < 0.10 are shown. (C) Coexpression analysis of TCR and STAT3 signaling scores split by the type of cell. STAT3mt status and scaled expression of STAT3 activation (red) and TCR signalosome scores (green) are highlighted in the same UMAP representation. Color scale corresponds to the signature score, and the color thresholds correspond to the 90th percentile of the scores. The cells are divided as STAT3mt, STAT3wt, and healthy controls. Gray dots correspond to STAT3 and TCR expression below the 90th percentile; red and green signals correspond to strong STAT3 and TCR signaling, respectively; yellow signals correspond to double STAT3/TCR-high signaling. (D) Proportion of cells with high values of STAT3 and TCR signaling scores according to the STAT3mt status. χ2 P values are shown. ****P < 0.0001. HC, healthy controls.
Figure 6
Figure 6. TCR repertoire analyses of the implications of the hcD variants associated with dominant IEI.
(A) Patient flow for TCR immunosequencing. Of 20 T-LGLL patients with WES and deep TCR sequencing, 18 patients were downstream analyzed after resampling to 5,420 clones. Data from 145 healthy controls from Pagliuca et al. were also used (45). (B) Pooled distribution of clones according to the expansion status. Nonexpanded, normally expanded, and pathologically expanded clonotypes are defined by 1, 2–5, and >5 templates, respectively. (C) Number of unique, normally expanded, and pathologically expanded clonotypes, inverse Simpson index, and mean clone size between T-LGLL versus healthy controls and between hcD carriers and noncarriers (NC) within the T-LGLL cases. One dot per sample. Mann-Whitney U test P values are shown. (D) Bar plot illustrating the condition-related known specificities of the whole repertoire (upper plot) and only the pathologically expanded clonotypes (lower plot) in healthy controls and T-LGLL patients with/without hcD variants. (E) Proposed model on the pathogenic role of underlying IEI in CTL proliferations and clonal shift (created with Biorender.com). Aberrant immune responses caused by genetic or acquired factors, both deficient or hyperreactive abnormal responses, may lead to antigen persistence and/or immune dysregulation and eventually result in T-LGLL as a pathologic overcompensation. *P < 0.05; **P < 0.01; ***P < 0.001. Ag: antigen; CMV, cytomegalovirus; IBD, inflammatory bowel disease; HPV, human papillomavirus; NOS, not otherwise specified; sIg, surface Ig; SLE, systemic lupus erythematosus; VZV, varicella zoster virus.

References

    1. Zawit M, et al. Large granular lymphocytic leukemia: from immunopathogenesis to treatment of refractory disease. Cancers (Basel) 2021;13(17):4418. doi: 10.3390/cancers13174418. - DOI - PMC - PubMed
    1. Sanikommu SR, et al. Clinical features and treatment outcomes in larg e granular lymphocytic leukemia (LGLL) Leuk Lymphoma. 2018;59(2):416–422. doi: 10.1080/10428194.2017.1339880. - DOI - PMC - PubMed
    1. Yang J, et al. TRAIL mediates and sustains constitutive NF-κB activation in LGL leukemia. Blood. 2018;131(25):2803–2815. doi: 10.1182/blood-2017-09-808816. - DOI - PMC - PubMed
    1. Zhang R, et al. Network model of survival signaling in large granular lymphocyte leukemia. Proc Natl Acad Sci U S A. 2008;105(42):16308–16313. doi: 10.1073/pnas.0806447105. - DOI - PMC - PubMed
    1. Cheon H, et al. Genomic landscape of TCRαβ and TCRγδ T-large granular lymphocyte leukemia. Blood. 2022;139(20):3058–3072. doi: 10.1182/blood.2021013164. - DOI - PMC - PubMed

Publication types

Substances