. 2025 May 1:10.1249/MSS.0000000000003748.
doi: 10.1249/MSS.0000000000003748. Online ahead of print.

Combining In Vivo 2-Photon Imaging with Photoactivatable Fluorescent Labeling Shows Low Rates of Mitochondrial Dynamics in Skeletal Muscle

Affiliations

Combining In Vivo 2-Photon Imaging with Photoactivatable Fluorescent Labeling Shows Low Rates of Mitochondrial Dynamics in Skeletal Muscle

Colleen L O'Reilly et al. Med Sci Sports Exerc. .

Abstract

Introduction: Mitochondrial dynamics involve two distinct and opposing processes, fusion and fission. Traditionally we assess fusion and fission by snapshots of protein markers at distinct time points or in vitro models to infer outcomes in vivo. Recent technological advancements enable visualization of mitochondrial dynamics in vivo using fluorescent microscopy.

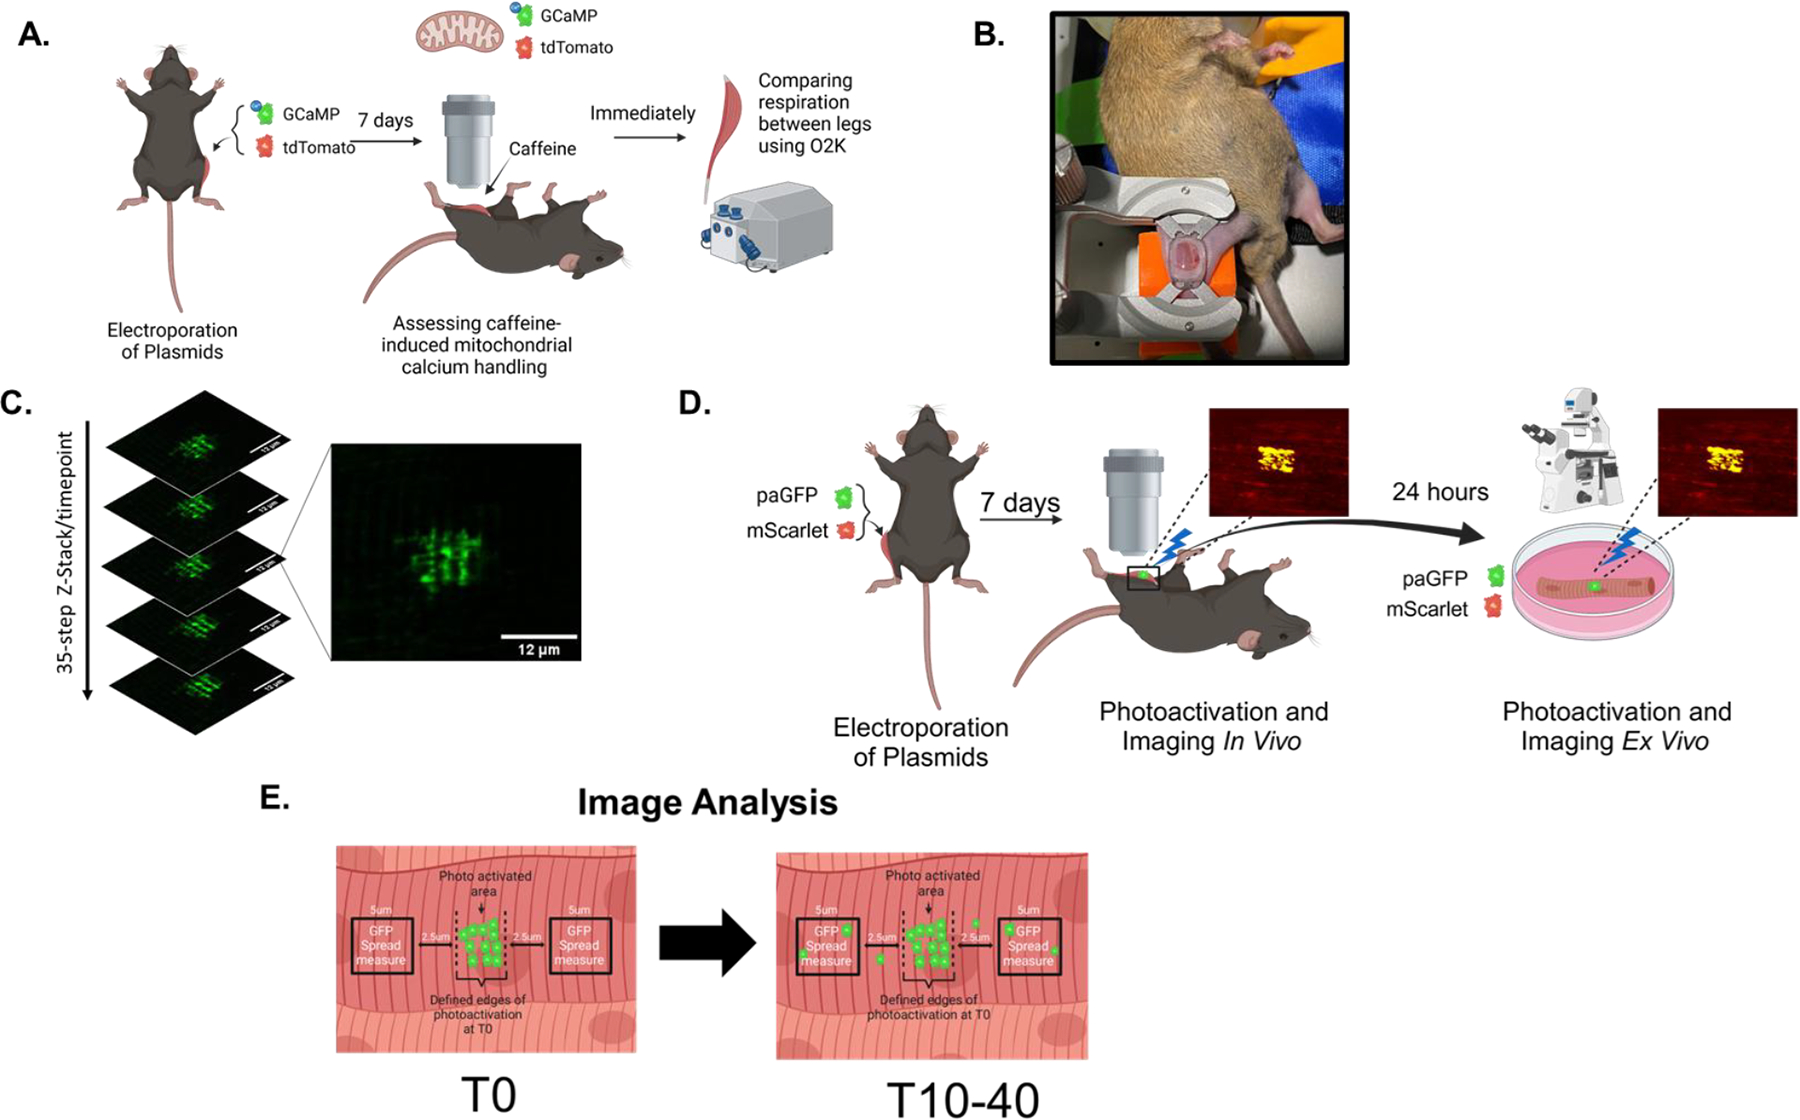
Methods: Our study modified this technique to evaluate mitochondrial dynamics in skeletal muscle, comparing young (6mo) and old (24mo) mice in vivo and contrasting this to ex vivo and in vitro models. We hypothesized that in vitro and ex vivo models would have higher rates of dynamics than in vivo models and that young animals would have higher rates than old animals. We electroporated mitochondrial matrix-targeted photo-activatable GFP into the tibialis anterior (TA) of young and old C57Bl6 mice and imaged using multiphoton microscopy. We also measured rates of mitochondrial dynamics using single fibers isolated from the TA of the electroporated mice, as well as C2C12 myotubes transfected with the same plasmids.

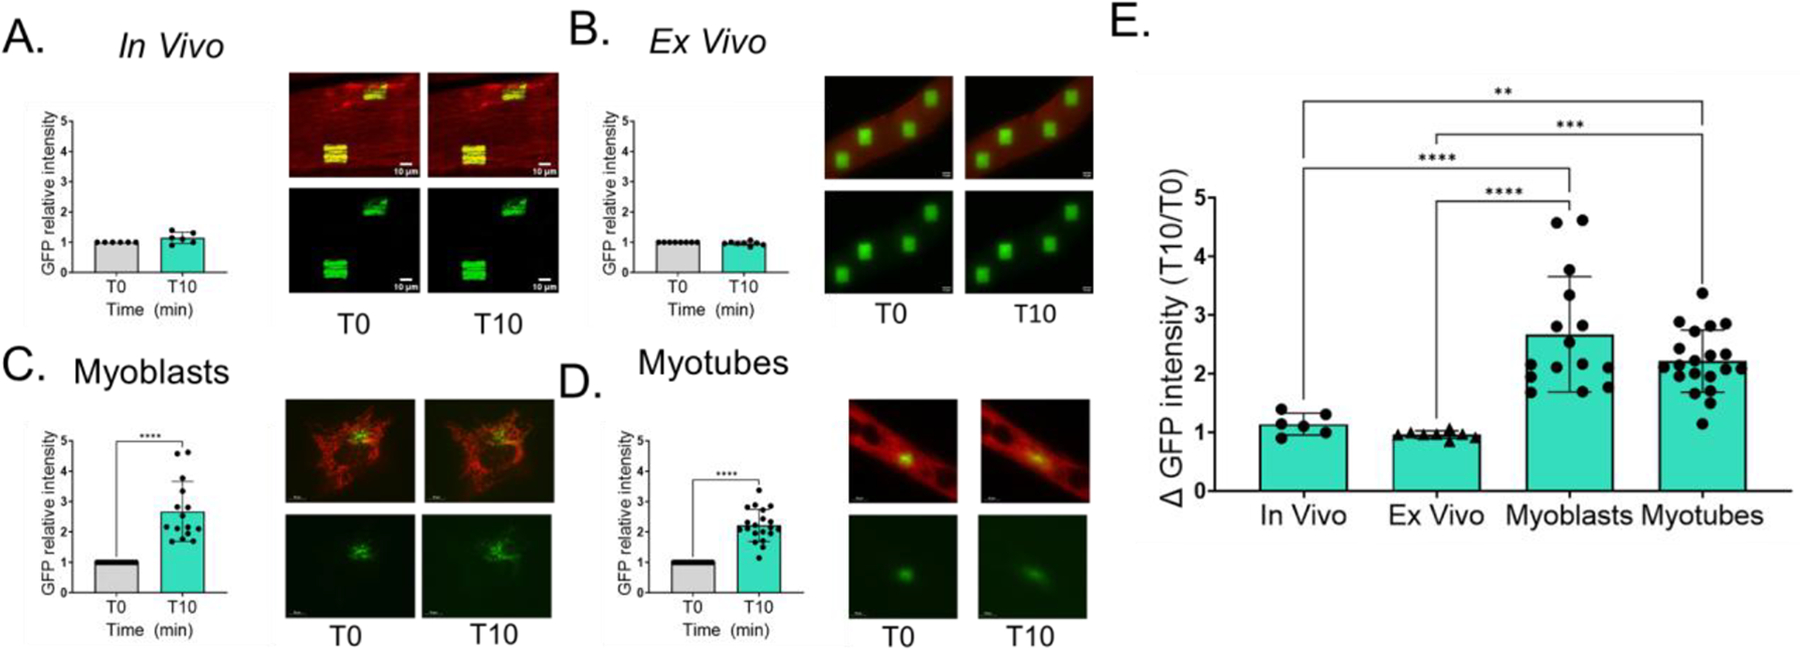
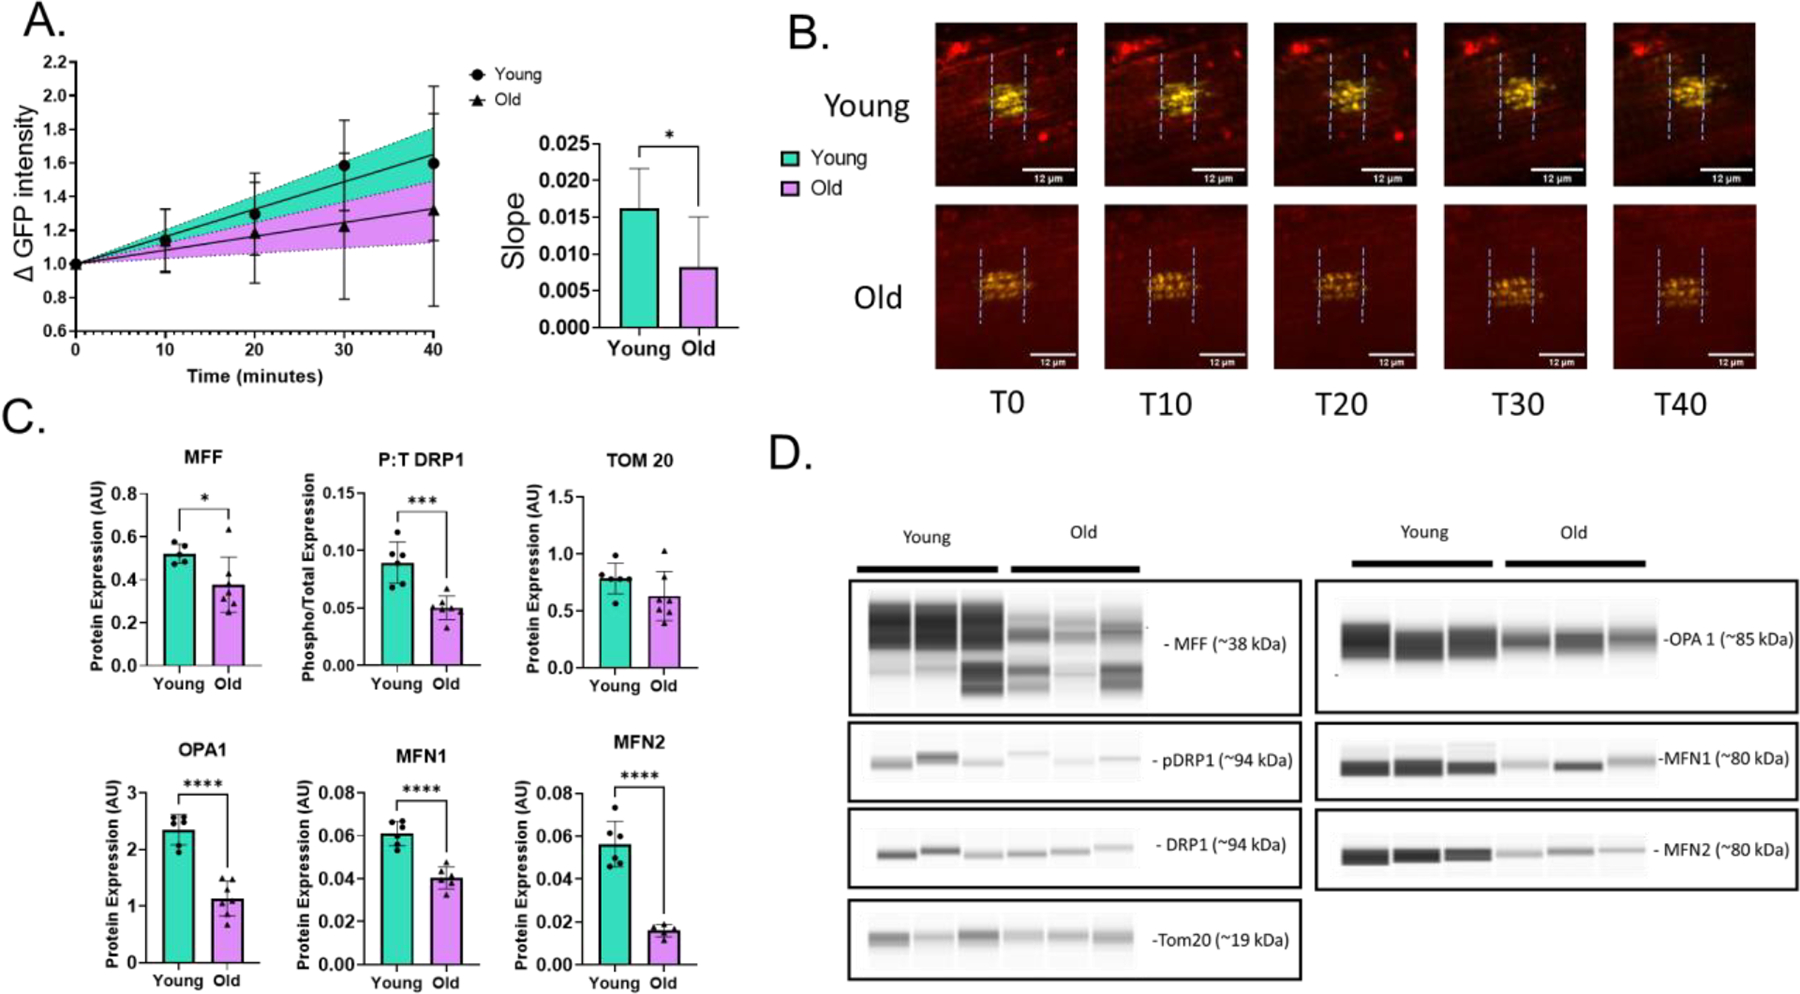
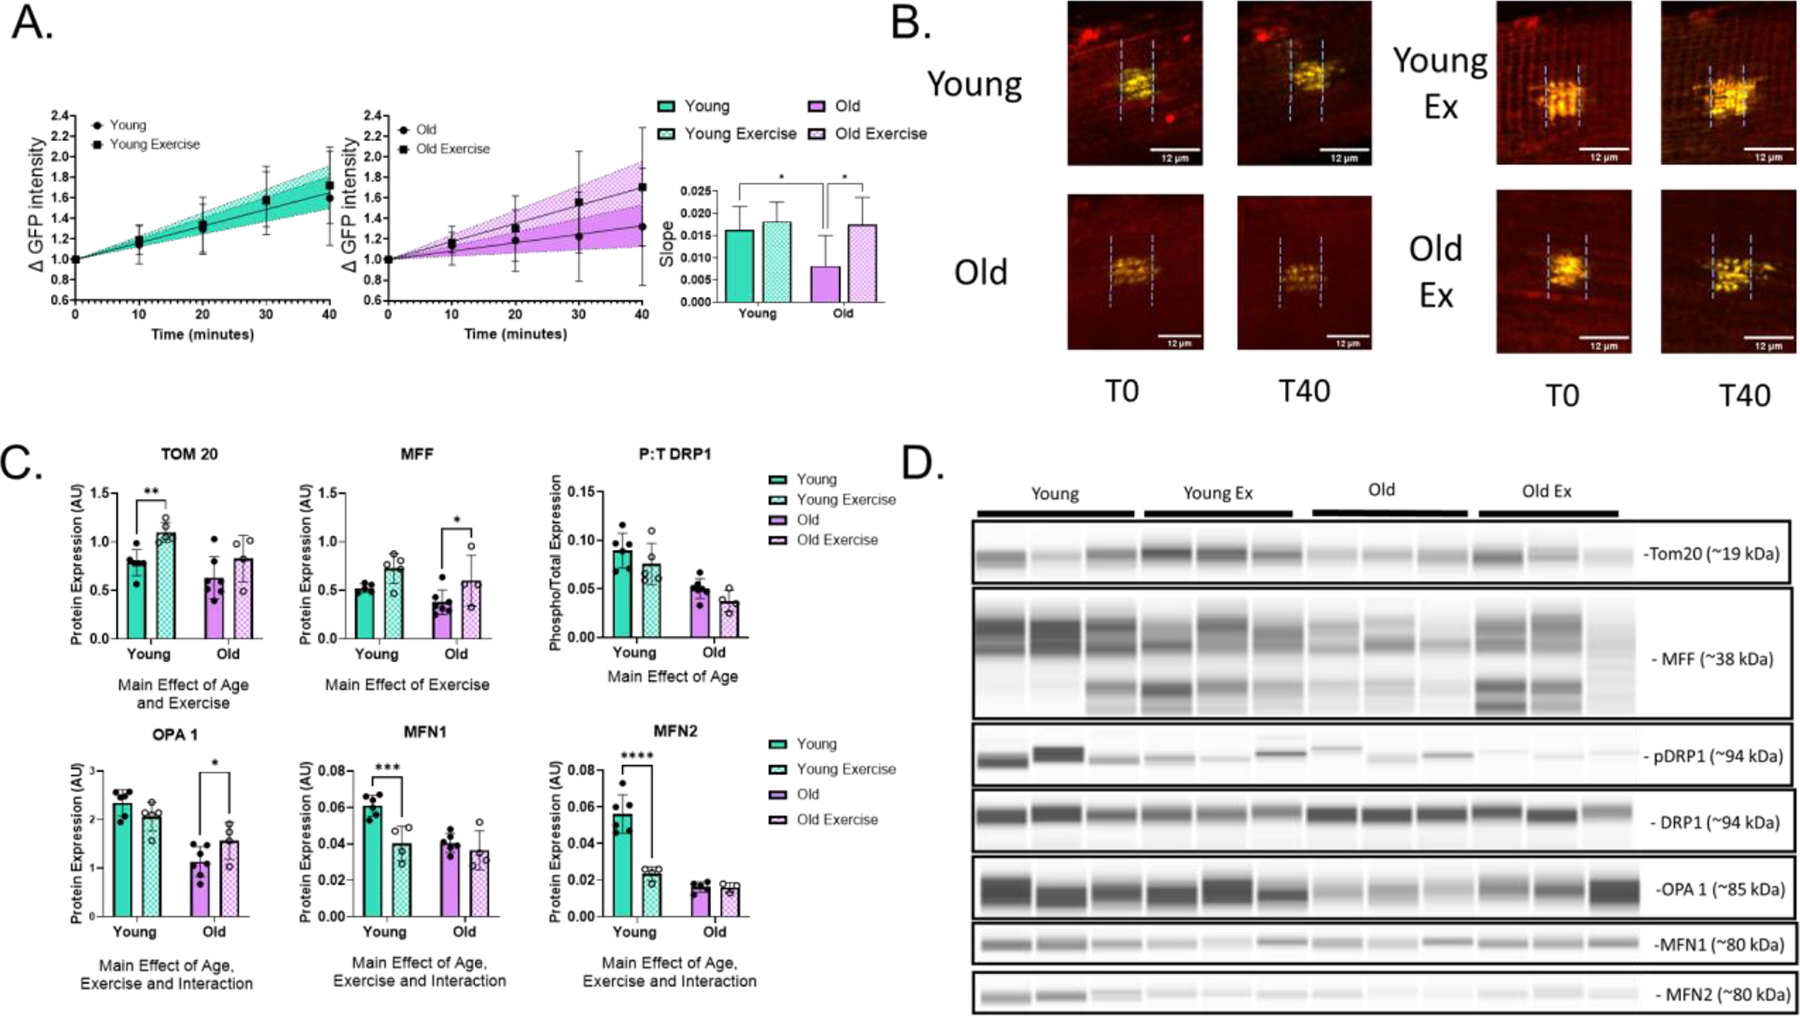
Results: We found that the rates of dynamic events in vivo are slower than previously indicated, with the C2C12 myoblasts having the fastest rates of dynamic events across all models. We also observed that dynamic rates are slower in old animals compared to young animals. Finally, we found that rates of dynamic events were higher in old animals after an acute bout of exercise.

Conclusions: Our data demonstrate it is possible to directly measure rates of mitochondrial dynamics in vivo. This technique provides a powerful tool to answer experimental questions about mitochondrial dynamics of skeletal muscle.

Keywords: FISSION; FUSION; MITOCHONDRIAL DYNAMICS; SKELETAL MUSCLE.


Conflict of interest statement

Conflict of Interest and Funding Source: NIH T32AG052363 – CLO; NIH R35GM137921 – TLL; Presbyterian Health Foundation – TLL & BFM

Figures

Figure 1:
Figure 1:. Methodology
(A) Methods and timeline of mitochondrial calcium uptake imaging with the 2-photon microscope and high resolution respirometry comparing the electroporated and nonelectroporated legs. (B) Picture of mouse mounted on 2-photon stage for live imaging of the tibialis anterior (TA). Mouse leg is mounted on a 3-D printed block and a cranial window is placed firmly across the TA muscle. Skin has been cut away and fascial layer removed. (C) Representative images of mt-pAGFP from one time point Z stack and single Z plane images prior to max projection (D) Methods and timeline of mitochondrial dynamic imaging using a photoactivatable GFP plasmid in vivo and ex vivo. (E) Detailed explanation of the GFP spread analysis used to measure rate of mitochondrial dynamics of max projection images across time points.
Figure 2.
Figure 2.. In vivo mitochondrial GCaMP imaging and respiration comparison.
(A) mt-GCaMP signal normalized to cytoplasmic tdTomato signal over 20 minutes. Red line illustrates the average of all animals. For each fiber ROI we created a ratio of mt-GCaMP (green) signal to cytoplasmic tdTomato (red) signal and plotted the ratio for each time point. We analyzed multiple fibers per animal (n=2–3 fibers). Each dot represents the average of all fibers analyzed for a particular animal. (B) representative images of mt-GCaMP (green) and cytosolic TdTomato (red) at T0 and T20. Scale = 40μm (C) representative fibers showing that intramitochondrial calcium went up upon caffeine administration and then began to decline. Contrast increased in both for visual clarity. Each image consisted of a 1024×1024 pixels image and were acquired through a 25 × 1.1 NA Nikon water objective with 1x zoom using Nikon NIS elements (Nikon instruments Inc., NY, USA (D) O2 Flux comparisons of control and electroporated legs of the mt-GCaMP imaged animals (n=5). Paired t-tests were performed for each substrate. Data are presented as means ± SD. ns=non-significant.
Figure 3.
Figure 3.. In vivo photoactivation imaging compared to ex vivo and in vitro models.
The photoactivatable GFP intensity spread at T0 immediately after photoactivation (gray bar) and at T10 GFP spread 10 minutes post photoactivation normalized to T0 (green bar) and representative images of mitochondrial targeted mScarlet (red) and photoactivatable GFP (green) of (A) In Vivo Tibialis Anterior of young mice (n=6). Each image consisted of a 35-step z-stack (1024×1024 pixels) and were acquired through a 25 × 1.1 NA Nikon water objective with 3x zoom using Nikon NIS elements. ROIs were activated using the Coherent Chameleon Vision Ultra tunable IR laser tuned to 760 nm, with 10 loops at 1% laser power (Scale= 10 μM) (B) Ex Vivo single fibers isolated from the TA of young mice (n=8). Each image consisted of a 35-step z-stack (2304×2304 pixels) and were acquired through a 40x on a Nikon Ti2-E microscope. (Scale= 14 μM) ROIs were drawn and assigned to a stimulation protocol carried out with an Optimicroscan XY galvo scanning unit (405nm stimulation laser at 2% laser power for 100μs per pixel). (C) In Vitro Myoblasts (n=15) and (D) In Vitro Myotubes (n=20). Each image consisted of a single plane image (2304×2304 pixels) and were acquired through a 60x oil immersion objective in a stage top incubator using a Nikon Ti2-E microscope using the same ROI activation as B (Scale= 10 μM). (E) Comparison of four models of GFP spread normalized to T0 spread. Contrast of all images were increased for visual clarity only. Asterisks indicate a statistical difference. T-tests were used to compare T0 and T10 and a One-Way ANOVA was completed for comparison of the four models, p<0.5. Data are presented as means ± SD. Enlarged representative images of 3A-D can be found in Supplemental Figure 1.
Figure 4.
Figure 4.. In vivo photoactivation imaging of old and young mice.
(A) Change in GFP intensity spread over 40 min comparing young (circle) and old (triangle) Tibialis Anterior with 95% confidence intervals of young (green) and old (purple). Slope of the line for the change in GFP intensity spread over 40 min for young (green) and old (purple). (B) Representative images of GFP intensity spread (green) for young and old animals from T0 to T40 (scale = 12μM). Dotted lines indicate edge of photoactivated area at T0. Each image consisted of a 35-step z-stack (1024×1024 pixels) and were acquired through a 25× 1.1 NA Nikon water objective with 3x zoom using Nikon NIS elements (Nikon instruments Inc., NY, USA. Brightness and contrast adjusted equally across all images for visual clarity only. (C) Comparison of young and old TA protein expression of fission and fusion markers normalized to total protein in arbitrary units. Analyzed targets were normalized to total protein measured with the total protein detection model according to manufacturers instructions (DM-TP01, ProteinSimple, San Jose, CA, USA) (D) Representative images of the protein simple capillary blots with molecular weights. T-tests were completed to compare young and old animals. Data are presented as means ± SD. Asterisks indicate p<0.05. Enlarged images of 4B can be found in supplemental figure 2. (n=6)
Figure 5.
Figure 5.. In vivo photoactivation imaging of old and young exercised mice.
(A) Change in GFP intensity spread over 40 min of young (circle), young exercised (square), old (circle) and old exercise (square) Tibialis Anterior with 95% confidence intervals of young (dark green), young exercise (lighter green), old (dark purple) and old exercise (light purple). Slope of the lines of the change in GFP intensity spread over 40 min for young (green), young exercise (light green), old (purple) and old exercise (light purple) (B) Representative images of GFP intensity spread (green) for young, young exercise, old and old exercise at T0 and T40 (scale = 12μM). Dotted lines indicate edge of photoactivated area at T0. Each image consisted of a 35-step z-stack (1024×1024 pixels) and were acquired through a 25× 1.1 NA Nikon water objective with 3x zoom using Nikon NIS elements (Nikon instruments Inc., NY, USA) Brightness and contrast adjusted equally across all images for visual clarity only. (C) Comparison of young, young exercise, old and old exercise TA protein expression of fission and fusion markers normalized to total protein in arbitrary units. Analyzed targets were normalized to total protein measured with the total protein detection model according to manufacturers instructions (DM-TP01, ProteinSimple, San Jose, CA, USA). (D) Representative images of the protein simple capillary blots. A Two-way ANOVA were performed to compare the slopes of the four groups. Data are presented as means ± SD. Asterisks indicate p<0.05. Enlarged images from 5B can be found in Supplemental figure 3. (n=4–6)

Similar articles

References

    1. dos Santos L, Cyrino ES, Antunes M, Santos DA, Sardinha LB. Sarcopenia and physical independence in older adults: the independent and synergic role of muscle mass and muscle function. Journal of Cachexia, Sarcopenia and Muscle. 2017;8(2):245–50. - PMC - PubMed
    1. Xu W, Chen T, Cai Y, Hu Y, Fan L, Wu C. Sarcopenia in Community-Dwelling Oldest Old is Associated with Disability and Poor Physical Function. J Nutr Health Aging. 2020;24(3):339–45. - PubMed
    1. Janssen I, Shepard DS, Katzmarzyk PT, Roubenoff R. The Healthcare Costs of Sarcopenia in the United States. Journal of the American Geriatrics Society. 2004;52(1):80–5. - PubMed
    1. Larsson L, Degens H, Li M, et al. Sarcopenia: Aging-Related Loss of Muscle Mass and Function. Physiological Reviews. 2019;99(1):427–511. - PMC - PubMed
    1. Short KR, Bigelow ML, Kahl J, et al. Decline in skeletal muscle mitochondrial function with aging in humans. Proceedings of the National Academy of Sciences. 2005;102(15):5618–23. - PMC - PubMed

LinkOut - more resources