Review
. 2025 Apr 14;15(8):998.
doi: 10.3390/diagnostics15080998.

Washout on Contrast-Enhanced Ultrasound of Benign Focal Liver Lesions-A Review on Its Frequency and Possible Causes

Affiliations
Review

Washout on Contrast-Enhanced Ultrasound of Benign Focal Liver Lesions-A Review on Its Frequency and Possible Causes

Kathleen Möller et al. Diagnostics (Basel). .

Abstract

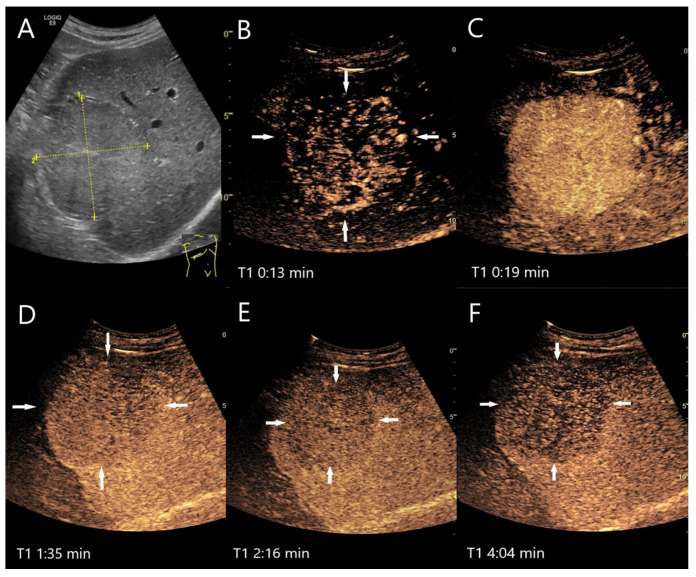
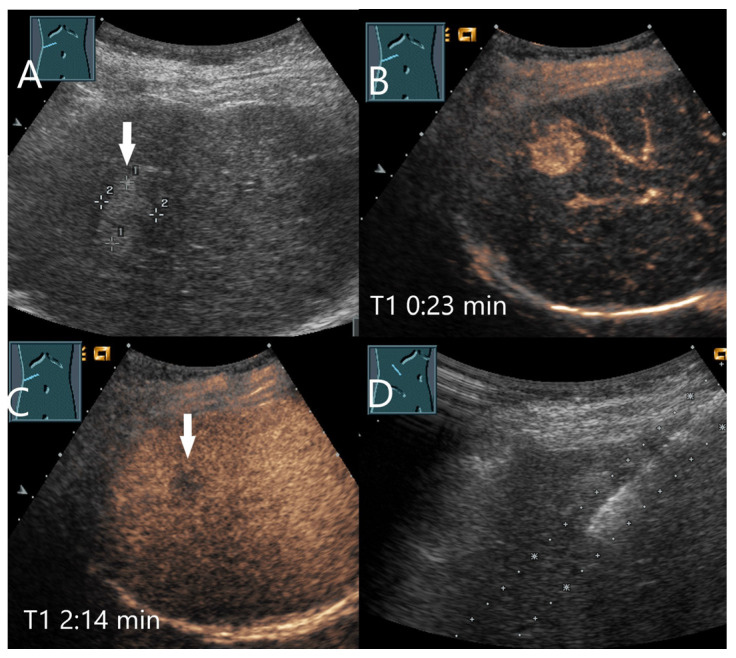
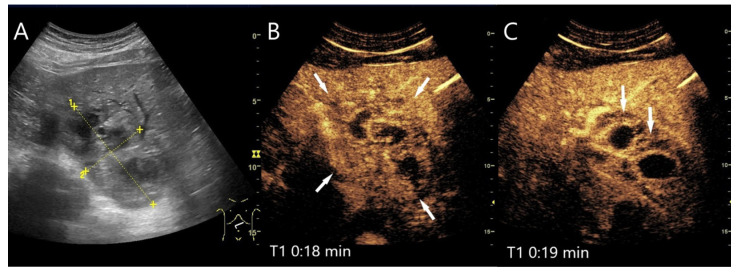
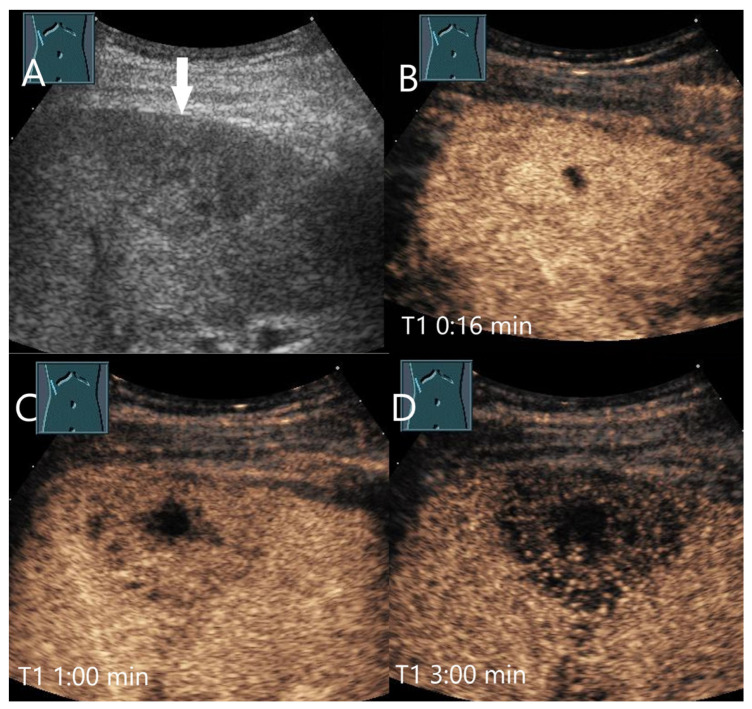
In all imaging methods, including contrast-enhanced ultrasound (CEUS), enhancement in the late phase (LP) is an important criterion for differentiating between benign and malignant focal liver lesions (FLLs). In general, malignant liver lesions are characterized by hypoenhancement and washout in the LP. A lesion with LP hyperenhancement or isoenhancement in the non-cirrhotic liver is usually benign. However, LP hypoenhancement in benign lesions is not so rare, and is even normal and the standard for some lesions, and there are exceptions for each tumor entity that can represent a diagnostic challenge. Knowing these contrast patterns and exceptions is key for correct diagnosis and patient management. The following narrative review describes the contrast behaviors and the frequency of washout and LP hypoenhancement for common as well as rare benign liver lesions and analyzes its causes.

Keywords: benign liver lesions; contrast-enhanced ultrasound (CEUS); hypoenhancement; late phase (LP); washout.


Conflict of interest statement

The authors declare that they have no financial conflicts of interest with regard to the content of this report. Martin Krix is an employee of Bracco.

Figures

Figure 1
Figure 1
Search strategy.
Figure 2
Figure 2
Partially fibrosed hemangioma. As part of a staging examination for adenocarcinoma of the gastro-esophageal junction, a 19 mm, smoothly bordered hyperechoic lesion (arrow) with an implied hypoechoic rim and punctate echogenic reflexes is diagnosed in the liver (A). On CEUS, the small lesion (between the markings) shows a marginal contrast image that is not completely smooth (B). In the PVP after 1:25 min, most of the lesion is enhanced, but slightly less than the surrounding parenchyma and with a small portion that is clearly hypoenhanced (C). After 3:04 min, the lesion is slightly hypoenhanced (D), while after 4:22 min (E) and 6:08 min (F), the lesion shows an unequivocal hypoenhancement. The lesion did not clearly correspond to a hemangioma on computed tomography either. This was the reason for a US-guided biopsy. Histology revealed a hemangioma, partially fibrosed and with tiny calcifications.
Figure 3
Figure 3
Cavernous hemangioma. Female patient. Incidental finding of a 40 × 32 mm heterogeneous hypoechoic FLL (A). The CEUS shows arterial marginal hyperenhancement after 14 s (B) and homogeneous AP hyperenhancement after 1:00 min (C). Decreasing heterogeneous hyperenhancement after 2:16 min (D) and 3:07 min (E). After 4:30 min (F), there is a clear hypoenhancement. Clinical ultrasound revealed the diagnosis of a hemangioma. Histologically, a cavernous hemangioma was confirmed.
Figure 4
Figure 4
FNH. Incidental finding as part of the diagnosis of choledocholithiasis. 20 mm large, slightly hypoechoic lesion (arrow) with contour protrusion of the liver, centrally visible vessel on color Doppler imaging (CDI) (A). In the CEUS, wheel-spoke-like central enhancement (B) and homogeneous hyperenhancement in the AP (C) is seen. In the PVP after 60 s, a very shallow washout begins (D). This continues in the LP at 2:05 min (E) and is very pronounced after 3:25 min (F). This was the reason for a US-guided biopsy. The histology was consistent with FNH with focal fibrosis.
Figure 5
Figure 5
FNH/nodular regenerative hyperplasia newly diagnosed in follow-up care after colon carcinoma and adjuvant chemotherapy with capecitabine and irinotecan. Initially, the lesions with a size up to 30 mm showed a wheel-spoke-like homogeneous hyperenhancement in the AP with isoenhancement in the PVP and LP. Over time, however, hypoenhancement developed in the LP. The images show the lesions three years after the initial diagnosis: the lesions (between the markings) are slightly larger (A). CEUS (B) and parametric imaging (C) show a typical wheel-spoke-like enhancement. In parametric imaging (C), the time of enhancement is displayed in different colors. The lesion is homogeneously hyperenhanced in the AP, a central scar is visible (D). In the LP, the lesions (arrows) are hypoenhanced with emphasis on the central parts (E,F). These lesions were, therefore, not clearly classifiable as benign, particularly in a patient with a history of colon carcinoma. A US-guided biopsy is performed. This revealed findings compatible with FNH and no evidence of metastases.
Figure 6
Figure 6
Inflammatory hepatocellular adenoma. Large mass (between the arrows) in the right lobe of the liver in a male patient (A). In the AP, the lesion shows a diffuse reticular enhancement (B), then a homogeneous hyperenhancement (C). In the PVP at 1:35 min, a shallow washout begins (D), which continues progressively in the LP (E,F). Histology after surgical resection confirmed the HCA.
Figure 7
Figure 7
ß-catenin-mutated HCA. Female patient. Incidental findings of a 19 × 17 mm hyperechoic FLL on B-mode US (arrow) (A). CEUS shows arterial hyperenhancement after 23 s (B). The center is less hyperenhanced. After 2:14 min, the lesion shows a slight washout (arrow) (C). The US-guided biopsy (D) revealed the diagnosis of a ß-catenin mutated HCA.
Figure 8
Figure 8
Pyogenic liver abscess. Male patient with right-sided upper abdominal pain and fever, but no previously known focus of infection. 95 × 52 mm inhomogeneous lesion in the liver (between the markings) with peripheral hypoechoic and central anechoic lesions (A). On CEUS, the lesion is hyperenhanced and central non-enhanced areas are demarcated (B). While the non-enhanced areas have a hyperenhanced rim, the initial hyperenhanced parts already show a washout in the AP and are hypoenhanced at a very early stage (arrows) (C). The findings corresponded to an abscess of unknown origin. Pus was obtained for microbiology during US-guided aspiration—proof of pathogenic E. coli.
Figure 9
Figure 9
Chronic pyogenic liver abscess. Patient with hypoechoic lesion (arrow) with high inflammatory laboratory (A). CEUS shows mild arterial hyperenhancement after 16 s (B), with mild washout after 1 min (C) and progressive washout after 3 min (D). The US-guided biopsy revealed the histologic diagnosis of a chronic granulocytic sclerosing inflammation.
Figure 10
Figure 10
Mycotic abscesses. Acute myeloid leukemia, female patient, condition after neutropenia under antimycotic therapy, now after regeneration of the bone marrow. B-scan US shows multiple hypoechoic FLLs with a maximum size of 10 mm (arrows) (A). CEUS shows a slight arterial hyperenhancement (arrow) after 18 s (B) with clear washout and hypoenhancement after 1 min in the PVP (C). The US-guided biopsy (D) revealed a diagnosis of inflammation without evidence of fungi, clinically corresponding to hepatic candidiasis.
Figure 11
Figure 11
Actinomycetes abscesses. In a patient with chronic calcifying pancreatitis and weight loss, multiple hypoechoic lesions with a maximum size of 20 mm were found in the liver (arrow). These lesions were suspicious for metastases on both ultrasound and CT. Initially unnoticed, the surrounding area was slightly more echoic (A). On CEUS, the lesions were hyperenhanced, including the slightly hyperechoic surroundings in the AP (B). In the PVP, a washout of the central parts began, while the surrounding area remained slightly hyperenhanced (C). In the LP, the central parts were clearly hypoenhanced (D). US-guided biopsy was performed under suspicion of metastases. The diagnosis of actinomycetes abscesses was made in the biopsy specimens.
Figure 12
Figure 12
Female patient with amebic abscess, fever, and general malaise after a stay in northern India. On B-mode US, a 90 × 65 mm large liquid hypoechoic, well demarcated FLL (A). The abscess was relieved by drainage and the position was checked by intracavitary CEUS (B). After complete drainage of the liquid contents, a hypoechoic lesion remained (C). The liver tissue surrounding the heterogeneous enhanced lesion showed a large area of arterial isoenhancement after 24 s (D). The lesion is hypoenhanced after 3 min with hyperenhanced surrounded parenchyma (E). Serology revealed an elevated amebic titer. Under appropriate therapy, regression occurred after 4 weeks (F). However, the lesion showed a hypoenhancement after 23 s (G) and progressive washout after 1 min (H).
Figure 13
Figure 13
Hepatic sarcoidosis. Hepatosplenomegaly, up to 15 mm hypoechoic lesions in the liver and spleen, generalized lymphadenopathy, and poor general condition. On CEUS, these liver lesions are homogeneously hyperenhanced in the AP (arrow) (A). Washout with hypoenhancement develops from the PVP onwards (arrow) (B). Figure (A,B) show the CEUS image with the corresponding B-mode image in low MI mode. The diagnosis of the hepatic manifestation of sarcoidosis was made by US-guided biopsy of the liver.
Figure 14
Figure 14
Sarcoidosis. Female patient with multiple hypoechoic liver lesions up to 10 mm. The CEUS shows after 25 s (A), 1 min (B), 2 min (C), and after 3 min (D) a progressive hypoenhancement. The US-guided biopsy revealed a diagnosis of hepatic sarcoidosis.
Figure 15
Figure 15
Necrotizing sarcoid granulomatosis (NSG) (special form of sarcoidosis characterized by granulomatous vasculitis of the pulmonary veins and pulmonary arteries). Female patient. Multiple confluent hypoechoic focal FLLs (A). CEUS shows progressive hypoenhancement after 1 min (B), 2 min (C), and after 4 min (D). The US-guided biopsy revealed a diagnosis of liver involvement in NSG.
Figure 16
Figure 16
IgG4-associated inflammatory pseudotumor. In a patient with elevated liver enzymes and alcohol abuse, B-mode US showed steatosis hepatis and a 55 × 20 mm irregular oval hypoechoic lesion (A). The central tubular structure was without flow evidence on CDI, and we interpreted this as a small bile duct branch. On CEUS, the lesion (arrows) was homogeneously hyperenhanced in the AP (B). In the PVP, a mild hypoenhancement developed (C), which became more pronounced in the LP (D).
Figure 17
Figure 17
IgG4-associated inflammatory pseudotumor. Male patient with pain in the right upper abdomen. The B-mode US shows a hypoechoic wall around the portal veins in the center of the hepatic hilus (A). CEUS shows a slight arterial hypoenhancement after 27 s (B) with clear parenchymal washout after 1 min in the PVP (C). This irregularly delimited area had a size of about 60 × 50 mm. The US-guided biopsy (D) was diagnostic for IgG4 positive chronic sclerosing lymphoplasmacytic inflammation.
Figure 18
Figure 18
Hepatic PEComa. In the left lobe of the liver there is a more than 5 cm large, oval, irregularly demarcated heterogeneous lesion (arrows) with several hyperechoic areas (A). In the AP of the CEUS (B) and in parametric imaging (C), the enhancement is initially lateral. The parametric imaging shows the chronological sequence of the arrival of the UCA in color. Then, the lesion is homogeneously hyperenhanced (D). In the PVP before 60 s, the hypoechoic parts show mild hypoenhancement (arrows) (E). The hyperechoic parts are isoenhanced or even slightly hyperenhanced. The hypoenhancement is slightly more pronounced at the beginning of the LP (F). This increases in the course of the LP (G) and is objectified in the time intensity curve (H). In the advanced LP the lesion shows a significant hypoenhancement (I). The washout with hypoenhancement was the reason for the US-guided biopsy, which resulted in a PEComa. This was confirmed by the histology of the surgical specimen.
Figure 19
Figure 19
Peliosis hepatis. Female patient. Hypoechoic lesion of 40 × 28 mm in a mildly steatotic liver (A). The CEUS shows arterial hyperenhancement after 25 s (B) with mild predominantly central hypoenhancement after 1 min (C) and 5 min (D). Histological confirmation was performed by US-guided biopsy. The adjacent small hypoechoic lesion (A) is isoenhanced in the CEUS in all phases.
Figure 20
Figure 20
Cholangiocellular adenoma. Male patient with elevated transaminases. A small, hypoechoic lesion < 10 mm (arrow) is seen in B-mode US (A). In the AP of CEUS, the lesion (between the markings) is homogeneously hyperenhanced (B). In the PVP < 60 s (C) and in the LP (D), the lesion is hypoenhanced. US-guided biopsy was performed under suspicion of a malignant lesion. However, the histology revealed a cholangiocellular adenoma. Surgical resection was performed with confirmation of a benign cholangiocellular adenoma.
Figure 21
Figure 21
Sclerosing bile duct adenoma. Female patient with a 31 × 27 mm hypoechoic round liver lesion as an incidental finding (A). The CEUS shows arterial hyperenhancement after 12 s (B) with hyperenhancement with mild predominantly central hypoenhancement after 1 min (C) and 3 min (D). Histological confirmation was performed by US-guided biopsy with histologic diagnosis of a benign sclerosed bile duct adenoma without relevant somatic mutations. This was confirmed by histology after surgical resection.
Figure 22
Figure 22
Extramedullary hematopoiesis. Male patient with myelodysplastic syndrome and secondary acute myeloid leukemia and multiple hypoechoic lesions (arrows) (A). CEUS shows inhomogeneous arterial liver enhancement after 13 s (B) with slight hypoenhancement after 1 min (C) and increasing hypoenhancement after 3 min (D) and 5 min (E). In addition, a wedge-shaped lesion with slight hypoenhancement is demarcated. US-guided biopsy revealed the diagnosis of extramedullary hematopoiesis.
Figure 23
Figure 23
Algorithm for the clarification of FLL.

Similar articles

References

    1. Dietrich C.F., Nolsøe C.P., Barr R.G., Berzigotti A., Burns P.N., Cantisani V., Chammas M.C., Chaubal N., Choi B.I., Clevert D.-A., et al. Guidelines and Good Clinical Practice Recommendations for Contrast-Enhanced Ultrasound (CEUS) in the Liver–Update 2020 WFUMB in Cooperation with EFSUMB, AFSUMB, AIUM, and FLAUS. Ultrasound Med. Biol. 2020;46:2579–2604. doi: 10.1016/j.ultrasmedbio.2020.04.030. - DOI - PubMed
    1. Lee J.Y., Minami Y., Choi B.I., Lee W.J., Chou Y.-H., Jeong W.K., Park M.-S., Kudo N., Lee M.W., Kamata K., et al. The AFSUMB Consensus Statements and Recommendations for the Clinical Practice of Contrast-Enhanced Ultrasound using Sonazoid. Ultrasonography. 2020;39:191–220. doi: 10.14366/usg.20057. - DOI - PMC - PubMed
    1. Kong W.-T., Ji Z.-B., Wang W.-P., Cai H., Huang B.-J., Ding H. Evaluation of Liver Metastases Using Contrast-Enhanced Ultrasound: Enhancement Patterns and Influencing Factors. Gut Liver. 2016;10:283–287. doi: 10.5009/gnl14324. - DOI - PMC - PubMed
    1. Bhayana D., Kim T.K., Jang H.-J., Burns P.N., Wilson S.R. Hypervascular Liver Masses on Contrast-Enhanced Ultrasound: The Importance of Washout. Am. J. Roentgenol. 2010;194:977–983. doi: 10.2214/AJR.09.3375. - DOI - PubMed
    1. Kong W., Wang W., Huang B., Ding H., Mao F. Value of wash-in and wash-out time in the diagnosis between hepatocellular carcinoma and other hepatic nodules with similar vascular pattern on contrast-enhanced ultrasound. J. Gastroenterol. Hepatol. 2014;29:576–580. doi: 10.1111/jgh.12394. - DOI - PubMed

LinkOut - more resources