. 2025 May;106(5):002099.
doi: 10.1099/jgv.0.002099.

Novel endornaviruses infecting Phytophthora cactorum that attenuate vegetative growth, promote sporangia formation and confer hypervirulence to the host oomycete

Affiliations

Novel endornaviruses infecting Phytophthora cactorum that attenuate vegetative growth, promote sporangia formation and confer hypervirulence to the host oomycete

Kohei Sakuta et al. J Gen Virol. 2025 May.

Abstract

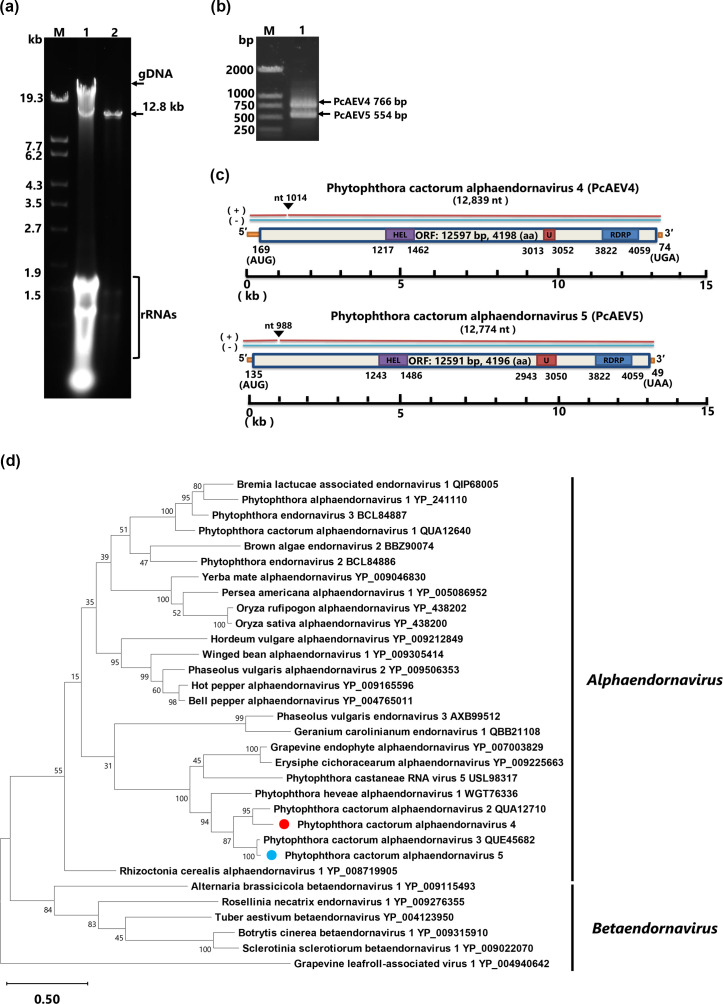
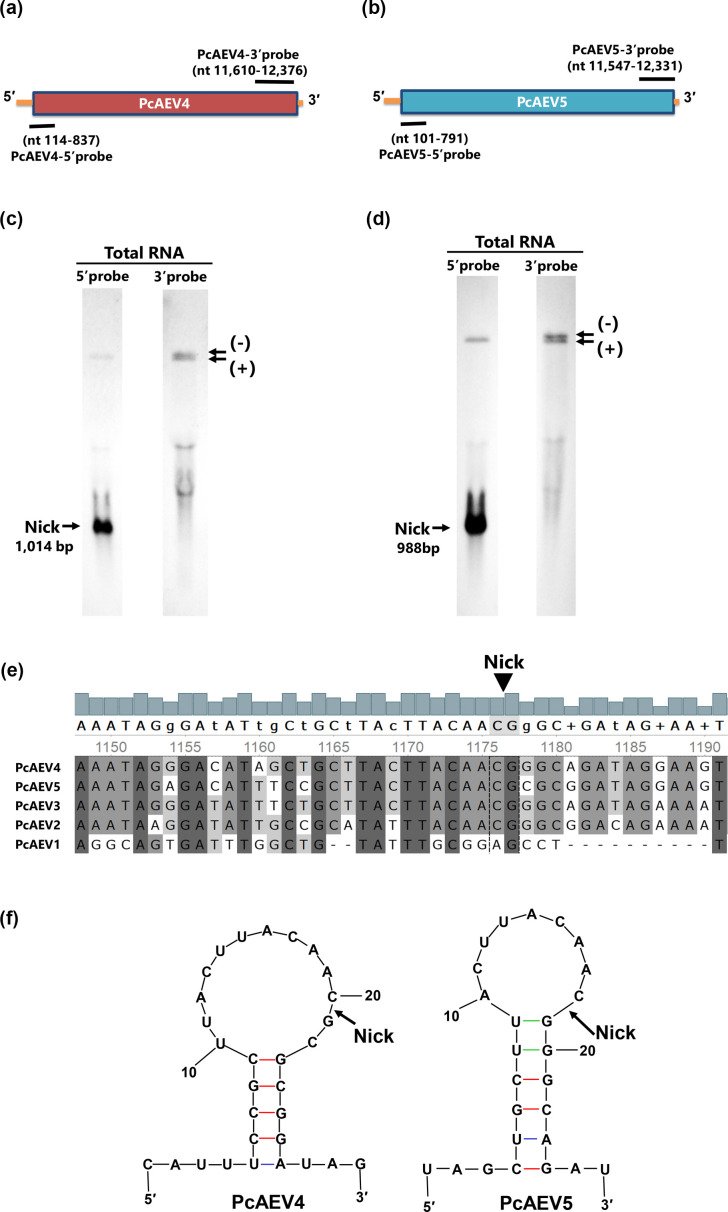
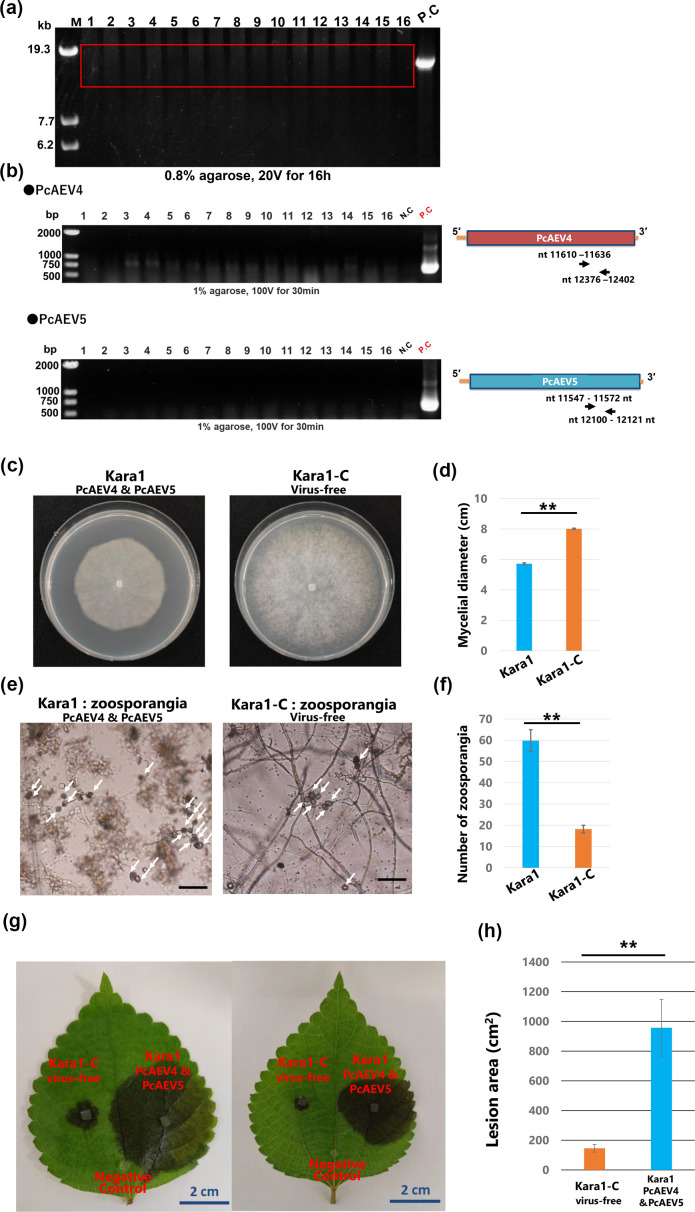
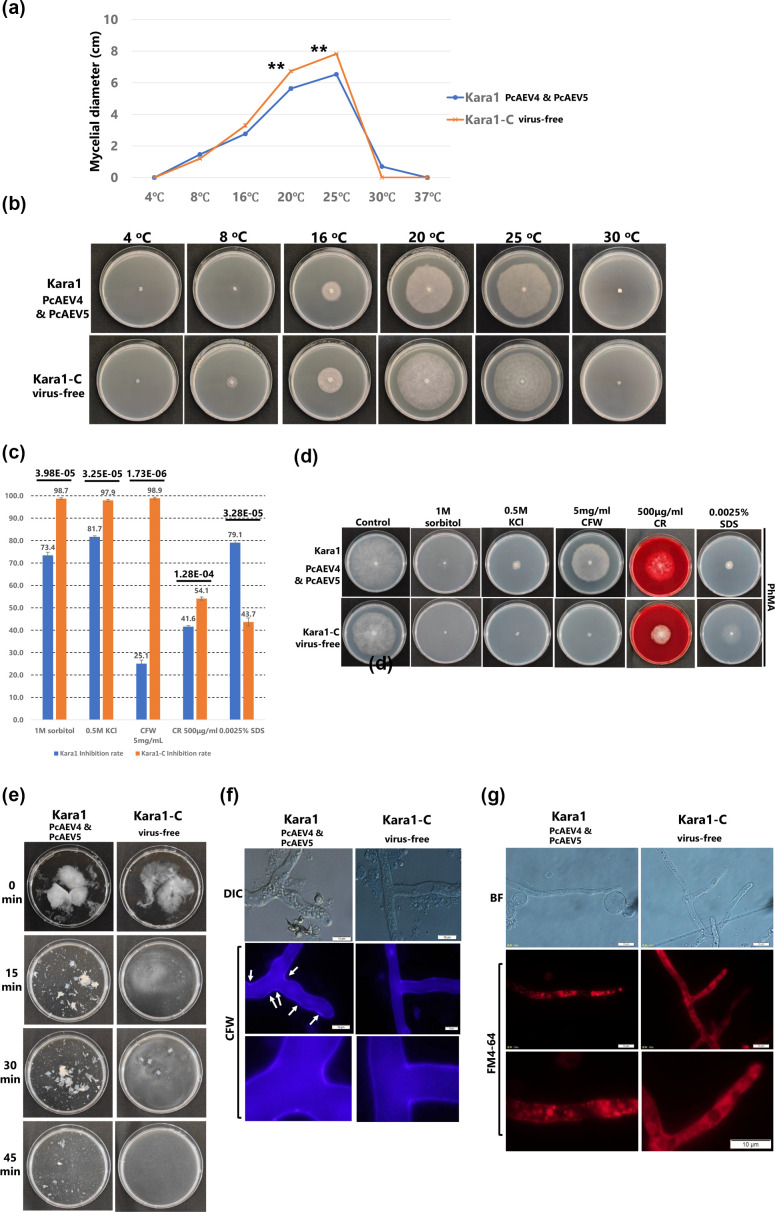
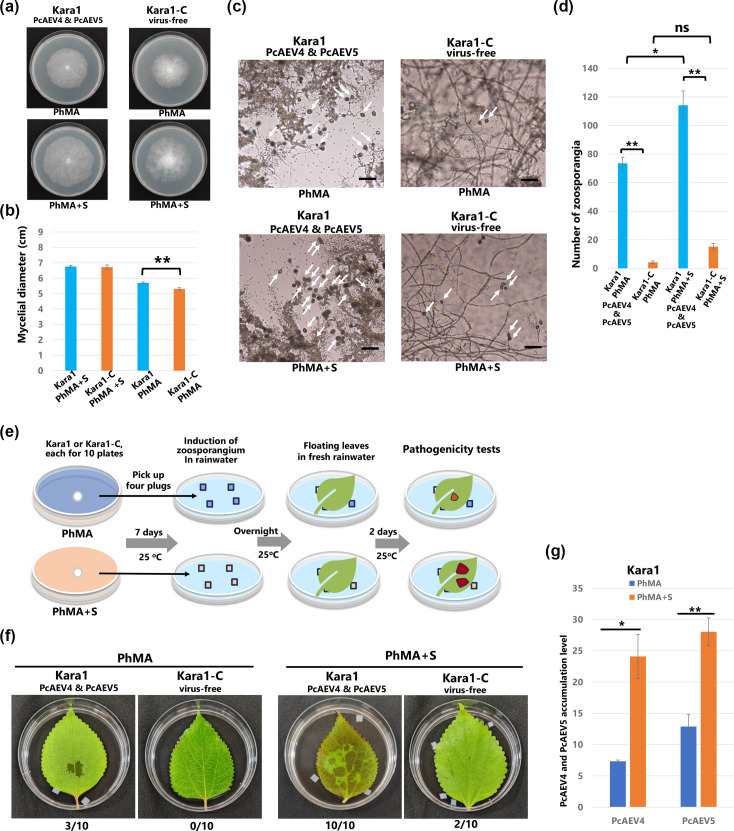
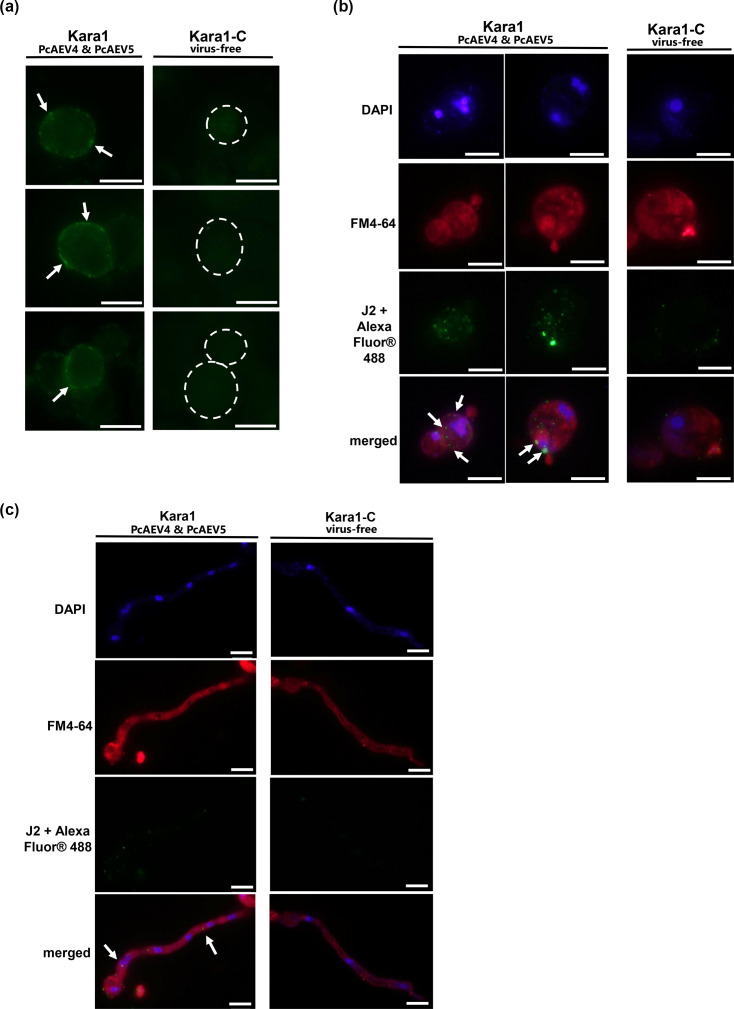
Two novel endornaviruses were found in Phytophthora cactorum isolated from black lesions on Boehmeria nivea var. nipononivea plants in a Japanese forest. These two endornaviruses were named Phytophthora cactorum alphaendornavirus 4 (PcAEV4) and Phytophthora cactorum alphaendornavirus 5 (PcAEV5) and have site-specific nick structures in their positive RNA strands, which are hallmarks of alphaendornaviruses. Ribavirin and cycloheximide treatment of the protoplasts effectively cured the host oomycete (strain Kara1) of the viruses. The resultant virus-free strain (Kara1-C) displayed abundant mycelial growth with less zoosporangia formation as compared to the Kara1 strain. Remarkably, the Kara1-C strain exhibited a reduced ability to form black lesions on B. nivea leaves, suggesting that the presence of PcAEV4 and PcAEV5 in the Kara1 strain led to enhanced virulence in host plants. Under osmotic pressure and cell wall synthesis inhibition, the Kara1 strain exhibited less growth inhibition compared with the Kara1-C strain. In contrast, the Kara1 strain showed more growth inhibition in the presence of membrane-permeable surfactant compared with the Kara1-C strain, indicating that the two endornaviruses can alter the susceptibility of the host oomycete to abiotic stresses. Co-localization and cell fractionation analyses showed that PcAEV4 and PcAEV5 localized to intracellular membranes, particularly the endoplasmic reticulum membrane fraction. Furthermore, infection with these two endornaviruses was found to affect the host's response to exogenous sterols, which enhanced vegetative growth and zoosporangia formation, as well as virulence of the host oomycete. These results provide insights into the effects of endornavirus infection in Phytophthora spp. and also highlight the usefulness of protoplast-based methods in advancing Phytophthora virus studies.

Keywords: Phytophthora; attenuation; endornavirus; hypervirulence; membrane fraction; site-specific nick.


Conflict of interest statement

The authors declare that there are no conflicts of interest.

Figures

Fig. 1.
Fig. 1.. Detection of PcAEV4 and PcAEV5 in the Kara1 strain of P. cactorum. (a) Agarose gel electrophoresis of dsRNA purified from the Kara1 strain. Lane designations: M: DNA marker (250 ng of λ DNA digested with EcoT14I); 1, total nucleic acid; 2, purified dsRNA. Electrophoresis was performed on 0.8% agarose gel at 40V for 6 h, followed by staining with ethidium bromide (0.5 µg ml−1). The arrows indicate the position of the 12.8 kb dsRNA and genomic DNA (gDNA). (b) Simultaneous detection by duplex reverse transcription PCR using PcAEV4- and PcAEV5-specific primers. Lane designations: M, DNA size marker; 1, dsRNA extracted from Kara1. (c) Genomic maps of PcAEV4 and PcAEV5 showing predicted amino acid numbers. Boxes represent large ORFs, and lines represent UTRs. HEL, viral helicase 1; U, UDP-glycosyltransferase; RdRp, viral RNA-dependent RNA polymerase. (d) Maximum likelihood tree (RAxML) showing the phylogenetic relationships of the putative RdRp of endornaviruses. Nodes are displayed with bootstrap support values ≥50%. Branch lengths are scaled to the expected number of amino acid substitutions per site. Grapevine leafroll-associated virus 1, an Ampelovirus of the family Closteroviridae, was used as an outgroup.
Fig. 2.
Fig. 2.. Identification and sequencing of nicks in the genomes of PcAEV4 and PcAEV5 co-infecting the Kara1 strain via Northern blot analysis. Schematic genomic maps of PcAEV4 (a) and PcAEV5 (b). Northern blot hybridization to detect nicks in PcAEV4 (c) and PcAEV5 (d) genomes. Approximately 20 µg of total RNA extracted from the Kara1 strain was loaded, and DIG-labelled DNA probes were used for detection. The probes were prepared at the following positions: PcAEV4-5′ (114–837 nt), PcAEV4-3′ (11,610–12,037 nt), PcAEV5-5’ (101–791 nt), and PcAEV5-3′ (11,547–12,331 nt). (e) Multiple sequence alignment of the nucleotide sequences surrounding the nicks identified in the endornaviruses of P. cactorum. The alignment was performed using clustalw, with perfectly matched nucleotides shaded in black and partially matched nucleotides shaded in grey. (f) Secondary structure prediction of the nick sequences of PcAEV4 and PcAEV5. Secondary structure prediction was carried out using the mfold server [62]. Black arrows indicate the nick sites.
Fig. 3.
Fig. 3.. Screening of virus-cured strains and comparison of phenotypes between the Kara1 and Kara1-C strains. (a) Electrophoresis of purified dsRNA extracted from protoplast-regenerated strains treated with ribavirin and cycloheximide. Electrophoresis was performed on 0.8% agarose gel at 20V for 16 h. PC, positive control, purified dsRNA extracted from the Kara1 strain. (b) Confirmation of PcAEV4 and PcAEV5 infection by one-step reverse transcription PCR. Reverse transcription PCR was performed using purified dsRNA as a template with the primer sets PcAEV4-3′ (11,610–12,037 nt) and PcAEV5-3′ (11,547–12,331 nt). NC, negative control, distilled water. Reverse transcription PCR was performed using dsRNA extracted from the Kara1 strain as a template. (c) Representative images showing the morphologies and (d) histogram that compares mycelial diameter of the colonies of the Kara1 and Kara1-C strains cultured on V8A medium for 7 days. (e) Representative images showing the morphologies and (f) histogram that compares several zoosporangia formation on cellophane membranes placed on V8A medium. Zoosporangia induction was performed by incubating hyphae cultured on cellophane membranes in distilled water under light conditions for 40 h, and zoosporangia in randomly selected fields was counted. (g) Representative images showing lesions and (h) histogram that compares lesion area induced by the Kara1 and Kara1-C strains on the detached leaves of B. nivea var. nipononivea. Photographs were taken at 2 dpi. Pathogenicity differences were quantified by measuring lesion areas on B. nivea var. nipononivea leaves at 2 dpi using ImageJ. Negative control was inoculation with distilled water on a different part of the same leaf. Error bars represent the sd from five to biological replicates of a representative experiment. Statistical analysis was performed using Student’s t-test (**P<0.01).
Fig. 4.
Fig. 4.. Comparison of growth of the Kara1 and Kara1-C strains under various stress conditions. (a) Histogram comparing the average colony diameters and (b) representative colony morphologies of the Kara1 and Kara1-C strains grown on V8A medium at different temperatures (4 °C, 8 °C, 16 °C, 20 °C, 25 °C, 30 °C and 37 °C) for 7 days. (c) Comparison of stress sensitivity between the Kara1 and Kara1-C strains. The blue bars represent the results for the Kara1 strain, and the orange bars represent the Kara1-C strain. The values inside the bars indicate the inhibition rates (%). Error bars represent sd from three biological replicates of a representative experiment. Statistical analysis was conducted using Student’s t-test, with the P-values indicated to the right of the black bars. (d) Representative colony morphologies of the Kara1 and Kara1-C strains grown for 10 days on PhMA medium exposed to different stress-inducing agents. (e) Comparison of cell wall integrity between the Kara1 and Kara1-C strains. Hyphal morphologies were observed after 15, 30 and 45 min of incubation in an isotonic solution containing cellulase and lysing enzyme. Equal amounts of hyphae from each strain were used for each treatment. (f) Calcofluor white (CFW) and (g) FM4-64 staining and visualization by fluorescence microscopy of hyphae from the Kara1 and Kara1-C strains. Scale bar, 10 µm.
Fig. 5.
Fig. 5.. Effects of exogenous sterols on the Kara1 and Kara1-C strains. (a) Representative images showing morphologies and (b) histograms that compare mycelial diameters of the colonies of the Kara1 and Kara1-C strains after 7 days of culture on PhMA or PhMA+S (PhMA containing 25 µg ml−1 β-sitosterol) medium. (c) Representative images and (d) histogram comparing several sporangia formed by the Kara1 and Kara1-C strains after 7 days of culture on PhMA or PhMA+S medium. Zoosporangia induction was performed by incubating hyphae cultured on cellophane membranes in DW under light conditions for 40 h, and sporangia were counted in randomly selected fields. (e) Pathogenicity assay with sporangia on detached B. nivea var. nipononivea leaves induced by the Kara1 and Kara1-C strains. Diagram of the sporangia-induced pathogenicity test. (f) Lesions induced by the Kara1 and Kara1-C strains on B. nivea var. nipononivea leaves at 2 dpi. Ten detached leaves were used for the pathogenicity test, with representative results shown. (g) qRT-PCR analysis of PcAEV4 and PcAEV5 RNA levels in the Kara1 strain grown on PhMA and PhMA+S media. WS21 (40S ribosomal protein S3A) was used as an internal control. Error bars represent the sd from five biological replicates of a representative experiment. Statistical analysis was performed using Student’s t-test or Tukey–Kramer test (*P<0.05, **P<0.01). ns indicates no significant difference.
Fig. 6.
Fig. 6.. Replication intermediates of PcAEV4 and PcAEV5 are concentrated in ER membrane fractions. (a) Overview of membrane fraction purification in the Kara1 strain. Crushed cell lysates were centrifuged at 1,000 g, 15,000 g, 20,000 g and 100,000 g. Pellets (Ppt) and supernatants (Sup) were collected and analysed. (b) Electrophoresis of total nucleic acids extracted from each fraction. Electrophoresis was performed on 0.8% agarose gel at 80 V for 2 h, followed by staining with ethidium bromide (0.5 µg ml−1). Note the different levels of concentration between pellet (p) and supernatant (s). Lane designations: M: DNA marker (250 ng of λDNA digested with EcoT14I). The arrow indicates the position of the 12.8 kb dsRNA. (c) RNase A sensitivity assay of PcAEV4 and PcAEV5. Portions of membrane fractions obtained by cell fractionation were incubated in isotonic solution containing RNase A at 37 °C for 30 min: the samples containing the dsRNAs were digested with pancreatic 1% RNase A (Fujifilm Wako, Osaka, Japan) in 10 ml of 2×SSC (1×SSC: 0.15 M NaC1, 0.015 M sodium citrate). Electrophoresis was performed using P15000, P20000 and P100000 fractions with (right lanes) or without (left lanes) 1% Triton X-100. Lane designations: M: DNA marker (250 ng of λDNA digested with EcoT14I). The arrows indicate the positions of mitochondrial genomic DNA (Mt DNA) and PcAEV4 and PcAEV5 dsRNA. (d) Sucrose gradient fractionation of microsomal fraction P100000. Fractions obtained were labelled 1 through 15 from top to bottom (lanes 1–15). Total nucleic acids were extracted from 1/10 of each fraction and subjected to agarose gel electrophoresis. Lane M: DNA marker (250 ng of λDNA digested with EcoT14I). The arrow indicates the position of PcAEV4 and PcAEV5 dsRNA. (e) The percentage of sucrose concentration was determined by refractometry. (f) A Western blot assay with an anti-KDEL antibody was performed after concentrating the obtained fractions tenfold, with equal amounts of protein loaded in all lanes. (g, h, i, j) Northern blot analysis of the sucrose gradient fractions of microsomal fraction P100000. Approximately 20 µg of total nucleic acids extracted from the obtained fractions was loaded, and DIG-labelled RNA probes were used for detection. Probes were prepared at the following positions: PcAEV4-5′ (114–837 nt) (g), PcAEV4-3′ (11,610–12,037 nt) (h), PcAEV5-5′ (101–791 nt) (i) and PcAEV5-3′ (11,547–12,331 nt) (j). Arrows indicate the positions of PcAEV4 and PcAEV5 genomic RNA (12.8 kb) and nicks (1 kb).
Fig. 7.
Fig. 7.. Visualization of endornavirus-derived dsRNA co-localized with membrane components by the dsRNA-specific antibody J2. (a) Detection of endornavirus-derived dsRNA labelled with J2 antibody in protoplasts of the Kara1 (left panels) and Kara1-C (right panels) strains. White arrows indicate representative green fluorescence strongly stained by J2 antibody, and white dashed lines outline cell positions. (b, c) Co-localization of endornavirus-derived dsRNA with lipid membranes stained by FM4-64 in regenerated protoplasts or regenerated mycelium of the Kara1 (left and middle panels) and Kara1-C (right panels) strains. (b) Protoplasts were regenerated overnight in a regeneration medium, followed by lipid membrane staining with FM4-64 and then fixation. DAPI staining was performed after the primary and secondary antibody reactions. White arrows indicate representative co-localization signals of lipid membranes stained with FM4-64 and dsRNA stained with J2 antibody. Kara1-C strain was used as a negative control. (c) Regenerated mycelium. Scale bar, 10 µm.

Similar articles

References

    1. Hollings M. Viruses associated with a die-back disease of cultivated mushroom. Nature. 1962;196:962–965. doi: 10.1038/196962a0. - DOI
    1. Dodds JA. Association of type 1 viral-like dsRNA with club-shaped particles in hypovirulent strains of Endothia parasitica. Virol. 1980;107:1–12. doi: 10.1016/0042-6822(80)90267-6. - DOI - PubMed
    1. Choi GH, Nuss DL. Hypovirulence of chestnut blight fungus conferred by an infectious viral cDNA. Science. 1992;257:800–803. doi: 10.1126/science.1496400. - DOI - PubMed
    1. Honkura R, Shirako Y, Ehara Y, Yamanaka S. Two types of virus-like particles isolated from downy mildew diseased rice plants. Jpn J Phytopathol. 1983;49:653–658. doi: 10.3186/jjphytopath.49.653. - DOI
    1. Hacker CV, Brasier CM, Buck KW. A double-stranded RNA from a Phytophthora species is related to the plant endornaviruses and contains a putative UDP glycosyltransferase gene. J Gen Virol. 2005;86:1561–1570. doi: 10.1099/vir.0.80808-0. - DOI - PubMed

MeSH terms

LinkOut - more resources