Comparative Study
. 2025 Dec;14(1):2494995.
doi: 10.1080/2162402X.2025.2494995. Epub 2025 May 1.

Avelumab induces greater Fc-Fc receptor-dependent natural killer cell activation and dendritic cell crosstalk compared to durvalumab

Affiliations
Comparative Study

Avelumab induces greater Fc-Fc receptor-dependent natural killer cell activation and dendritic cell crosstalk compared to durvalumab

Nicole Osborne et al. Oncoimmunology. 2025 Dec.

Abstract

Several FDA-approved anti-PD-L1 (programmed cell death ligand-1) monoclonal antibodies (mAbs) are used to treat cancer. While these mAbs primarily target and intercept PD-L1:PD-1 inhibitory signaling in T-cells, the Fc-domains of these mAbs are distinct, and the unique cellular cascades triggered by differing Fc-domains of PD-L1 mAbs have not been directly investigated. In this study, we compared the innate immune effects of two widely used anti-PD-L1 IgG1 mAbs which bear distinct Fc-domains, avelumab (native-Fc) and durvalumab (mutated-Fc), using two-cell and three-cell co-culture systems containing Natural Killer cells (NK-cells), dendritic cells (DCs) and various tumor cell lines of multiple cancer origins. We show a robust enhancement in NK-cell effector function, DC maturation, reciprocal NK:DC crosstalk and DC editing that is unique to avelumab treatment using multiple functional immune assays. By transcriptomic analysis, we show for the first time pivotal differences in gene sets involved in NK-cell effector function, DC maturation, immunoregulatory interactions, and cytokine production between innate immune cells treated with avelumab versus durvalumab. Furthermore, we report several previously unknown Fc-receptor-associated biological pathways uniquely triggered by avelumab. Our findings elucidate novel mechanisms of Fc-dependent actions of PD-L1 mAbs which may inform their use in future clinical trials.

Keywords: ADCC; FCGR; Fc-domain; IgG1; PD-L1; dendritic cell maturation; immune crosstalk; immunogenomics; mabs.


Conflict of interest statement

T.A.C. is a co-founder of Gritstone Oncology and holds equity. T.A.C. holds equity in An2H. T.A.C. acknowledges grant funding from Bristol-Myers Squibb, AstraZeneca, Illumina, Pfizer, An2H, and Eisai. T.A.C. has served as an advisor for Bristol-Myers, MedImmune, Squibb, Illumina, Eisai, AstraZeneca, and An2H. T.A.C. is an inventor on intellectual property and patent held by MSKCC on using tumor mutation burden to predict immunotherapy response, which has been licensed to PGDx. NO, AR, VM, RMS have no potential conflict of interest.

Figures
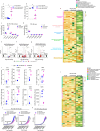
Figure 1.
Figure 1.
Avelumab enhances NK-cell activation versus durvalumab. (a-b), FACS analysis of surface CD137 (a), and CD16 (b), expression in CD56+ NK-cells after co-culture with PCI-15B (n = 5 HDs, 1:1 ratio) in the presence of IgG1, durvalumab or avelumab (10 µg/ml, ~ 24 hours). Tukey’s multiple comparison test was performed to identify statistical differences (p-value, *<0.05). (c), DGE analysis plot of FCGR family member transcripts in NK:PCI-15B co-cultures (n = 3 technical replicates, 5:1 ratio) after treatment with either no ab, durvalumab or avelumab (10 µg/ml, ~ 24 hours). 2-way ANOVA multiple comparison test shows significant differences (p-value, ****<0.0001). (d), DGE analysis plot of FCGR family member transcripts in PCI-15B alone after treatment with no ab, durvalumab or avelumab (10 µg/ml, ~ 24 hours). (e-g), Volcano plots showing differentially expressed transcripts between treatment groups in NK:PCI-15B cocultures, (e) durvalumab vs. no ab, (f) avelumab vs. no ab, (g) avelumab vs. durvalumab. Log2FC cutoff 0.5, and p-value cutoff 10e-3 was applied. Log2FC represents the mean expression level of each transcript. The number of transcripts upregulated and downregulated are denoted for each comparison. (h), heatmap of the expression of NK-cell effector function related transcripts in NK:PCI-15B co-cultures (n = 3 technical replicates, 5:1 ratio) after no ab, durvalumab or avelumab treatment. (i), FACS analysis of various NK-cell effector protein molecules that were enhanced by avelumab vs durvalumab treatment in NK:PCI-15B co-cultures (1:1 ratio, 10 µg/ml, ~ 24 hours, n = 3 HDs). Paired t-test was performed to evaluate statistical differences. 0.1234 (ns), 0.0332 (*), 0.0021 (**), 0.0002 (***), <0.0001 (****). (j), xCELLigence RTCA impedance plots measuring PCI-15B growth over  ~  85 hours with NK-cell addition (n = 2 HDs). mAbs were added just before starting the xCELLigence experiment, and NK-cells were added at the  ~  24 h mark (arrow sign). (k), RTCA impedance plots measuring PCI-15B growth over  ~  85 hours without NK-cells. mAbs were added just before starting the xCELLigence experiment. Measurements were recorded every 15 minutes, and data was plotted using GraphPad Prism v10. 2-way ANOVA multiple comparison test was performed to identify statistical differences (p value, ****<0.0001) (l), Heatmap of NK cell effector function related transcript expression of different groups of cytokines, chemokines and their cognate receptors in NK:PCI-15B co-cultures (n = 3 technical replicates, 5:1 ratio) treated with no Ab, durvalumab or avelumab.
Figure 2.
Figure 2.
Avelumab treatment increases expression of immune effector-related gene sets. (a-b), Gene Set Enrichment Analysis (GSEA) was performed using Hallmark gene sets on the differentially expressed gene list comparing (a) NK:PCI-15B:durvalumab vs. NK:PCI-15B:no Ab, and (b) NK:PCI-15B:avelumab vs. NK:PCI-15B:no Ab. Red dots represent the changes in GSEA hallmark gene sets after treatment. Dot sizes represent the number of differentially expressed transcripts (counts) included in the respective gene sets. Gene set names in red rectangles in figure (a) (durvalumab vs. no Ab) and figure (b) (avelumab vs. no Ab) are common. All gene sets shown here are adjusted p-value <0.05. (c), GSEA for Reactome pathway analysis was performed using Reactome gene sets on the differentially expressed gene list comparing different treatment groups. Column a; NK:PCI-15B:durvalumab vs. NK:PCI-15B:no Ab, column b; NK:PCI-15B:avelumab vs. NK:PCI-15B:no Ab, and column c; NK:PCI-15B:avelumab vs. NK:PCI-15B: durvalumab. A color coded heatmap was created based on NES values, and averaged scaled expression values. The top 50 and bottom 50 transcripts from each comparison were included. Cells are color-coded by NES score ( − 2 to  +  2), and p-values <0.05 were rounded to #0 after the second digit and included in each cell.
Figure 3.
Figure 3.
Avelumab-activated NK-cells enhance DC maturation versus durvalumab. (a), Summary graph showing fold changes in the CD86 MFI of HLA-DR+ DCs (n = 5 HDs) in DC:PCI-15B (1:1 ratio), DC:NK (1:1 ratio), and NK:DC:PCI-15B co-cultures (1:1:1 ratio) after treatment with IgG1, durvalumab or avelumab (10 µg/ml, ~ 48 hours). Two-way ANOVA multiple t-tests were performed to evaluate statistical differences. 0.1234 (ns), 0.0332 (*), 0.0021 (**), 0.0002 (***), <0.0001 (****). (b), Heatmap displaying the differential expression level of DC immune function related transcripts by treatment group (n = 3 technical replicates). The color gradient bar represents the relative expression of DC maturation-associated transcripts in 6 distinct groups. (c), Summary graphs showing fold changes in the CD86 MFI of HLA-DR+ DCs (n = 3 HDs, 2 technical replicates per HD) in NK:DC:tumor cell (tumor cells are A498, FADU, 786-O or UMUC3) co-cultures (1:1:1 ratio) after treatment with IgG1, durvalumab or avelumab (10 µg/ml, ~ 48 hours). Aggregated replicates from each donor are shown. One way ANOVA multiple t-tests were performed to evaluate statistical differences. 0.1234 (ns), 0.0332 (*), 0.0021 (**), 0.0002 (***), <0.0001 (****). (d), Summary graph and histograms showing fold changes in HLA-DR MFI, SLAMF7 MFI and TIM3 MFI (n = 3 HDs) in NK:DC:PCI-15B co-cultures (1:1:1 ratio) after treatment with IgG1, durvalumab or avelumab (10 µg/ml, ~ 48 hours). Paired t-tests were performed to evaluate statistical differences. 0.1234 (ns), 0.0332 (*), 0.0021 (**). (e), Heatmap showing expression of NK-cell effector function related transcripts by treatment type (n = 3 technical replicates) in 6 distinct groups. The color-coded gradient bar represents relative gene expression. (f), Heatmap showing expression profiles of chemokine, cytokine and their receptor transcripts by treatment types in 10 distinct groups.
Figure 4.
Figure 4.
Avelumab treatment promotes NK:DC cross-talk. (a-c), Volcano plots and bar charts in each panel show significantly different transcripts in NK:DC:PCI-15B co-cultures (1:1:1 ratio) treated with (a), durvalumab vs. IgG1, (b), avelumab vs. IgG1, and (c), avelumab vs. durvalumab, (10 µg/ml, ~ 48 hours). (d-f), Hallmark pathway analysis of NK:DC:PCI-15B co-cultures (1:1:1 ratio) treated with (d), durvalumab vs. IgG1, (e), avelumab vs. IgG1, and (f), avelumab vs. durvalumab, (10 µg/ml, ~ 48 hours). (g), Plot showing the differences in NES of selected Hallmark pathway comparisons by treatment. (h-j), Heatmaps of the relative expression of (h), IFNG response transcripts, (i), IL-2/STAT5 signaling transcripts, or (j), allograft rejection pathway transcripts by treatment. Avelumab; dark blue, durvalumab; light blue. (k), GSEA for Reactome pathways was performed using Reactome gene sets on the differentially expressed gene list comparing different groups. Column a, NK:DC:PCI-15B:durvalumab vs. NK:DC:PCI-15B:IgG1, column b, NK:DC:PCI-15B:avelumab vs. NK:DC:PCI-15B:IgG1, and column c, NK:DC:PCI-15B:avelumab vs. NK:DC:PCI-15B:durvalumab. A heatmap was created based on NES, and averaged scaled expression values. The top 50 and bottom 50 transcripts from each comparison were included. Color coding depicts the NES score ( − 2 to  +  2). P-values <0.05 were rounded to #0 after the second digit and included in each cell.
Figure 4.
Figure 4.
(Continued).
Figure 5.
Figure 5.
Avelumab and durvalumab differentially impact tumor cell-intrinsic gene sets and biological pathways. (a-c), Volcano plots show significantly differentially expressed transcripts in PCI-15B alone treated with (a), durvalumab vs. no Ab, (b), avelumab vs. no Ab, or (c), avelumab vs. durvalumab (10 µg/ml, ~ 48 hours). (d-f), Hallmark pathway analysis of PCI-15B cells treated with (d), durvalumab vs. no Ab, (e), avelumab vs. no Ab, and (f), avelumab vs. durvalumab. (g), Graph showing positive NES of select Hallmark pathways identified in figures (d-f). (h), GSEA for Reactome pathways was performed using Reactome gene sets on the differentially expressed gene list comparing different treatment groups. Column a, PCI-15B:durvalumab vs. PCI-15B:no Ab, column b, PCI-15B:avelumab vs. PCI-15B:no Ab, and column c, PCI-15B:avelumab vs. PCI-15B:durvalumab. A heatmap was created based on NES, and averaged scaled expression values. The top 50 and bottom 50 transcripts from each comparison were included. The black arrows indicate the immune related pathways in tumor, whereas red arrows indicate tumor growth associated pathways. Color coding depicts the NES score ( − 2 to  +  2). P-values <0.05 were rounded to #0 after the second digit and included in each cell.
Figure 6.
Figure 6.
DCs enhance the effector function of avelumab-activated NK cells. (a), Plots measuring PCI-15B growth over the course of  ~  85 hours using the xCELLigence RTCA system. Avelumab-treated PCI-15B were co-cultured with DCs, and when applicable NK-cells were added at the  ~  24 h mark from 2 HDs. Measurements were taken every 15 minutes and data (Mean ± sd) was plotted using GraphPad Prism v10. Paired t-tests were performed to identify statistical differences between relevant groups. (****p < 0.0001). (b), Scatter plots showing NK-cell intracellular and surface activation marker expression in NK:PCI-15B co-cultures (1:1 ratio) and NK:DC:PCI-15B co-cultures (1:1:1 ratio) after treatment with IgG1, durvalumab, or avelumab (10 µg/ml, ~ 24 hours, n = 3 HDs). A 2-way ANOVA test was performed to identify statistical differences between and among treatment groups for each marker. 0.1234 (ns), 0.0332 (*), 0.0021 (**), 0.0002 (***), <0.0001 (****). (c), Plot showing the number of IFN-γ spots in NK:PCI-15B co-cultures (1:1 ratio) and NK:DC:PCI-15B co-cultures (1:1:1 ratio) (25,000 each cell type) by mAb treatment (10 µg/ml, ~ 24 hours). IFN-γ spots were counted using the SmartCount feature of the CTL ImmunoSpot Software. Data represents the cumulative mean ± SEM from aggregated replicates from each donor (n = 6). Data is plotted using GraphPad Prism v10. Paired t-tests were performed to identify statistical differences, and p-values are shown in the figure. (d), Scatter plot showing percent CD56+ CD137+ NK cells in co-cultures containing immature or LPS + IFN-γ treated mature DCs by mAb treatment (10 µg/ml, 24 h). n = 3 HDs were used, and statistical differences were calculated using aggregated replicates from each donor. A 2-way ANOVA multiple comparison test was performed to identify statistical differences (*p < 0.05,****p < 0.0001). (e), Dot plots showing CD56+ CD137+ NK cells by treatment type in co-cultures containing immature or mature DCs. (f), Dot plots of CD137 expression in CD56+CD3 NK cells following co-culture with DCs (1:1) or DCs and PCI-15B (1:1:1) plus mAb treatment (10 µg/ml, ~ 24 hours, n = 3 HDs). (g), Scatter plot showing the percent CD56+ CD137+ NK cells by treatment and co-culture condition (10 µg/ml, ~ 24 hours, n = 3 HDs). A 2-way ANOVA test was performed to identify statistical differences (**p = 0.0015). (h), dot plots of CD137 expression in CD56+CD3 NK cells following co-culture with DCs (1:1), or DCs and A549 (1:1:1) plus mAb treatments (10 µg/ml, ~ 24 hours).
Figure 7.
Figure 7.
DC killing by avelumab-activated NK cells. (a), Bar graph showing % DAPI+ HLA-DR+ immature DCs (iDCs) and LPS + IFN-γ matured-DCs (mDCs) after co-culture with NK-cells (1:5 ratio, 24 hours, n = 4 HDs). An unpaired t-test was performed to identify statistical differences (*p < 0.05). (b), Scatter plot showing percentage DAPI+ HLA-DR+ DCs by treatment and co-culture condition with or without PCI-15B cells (n = 3 HDs), NK cells (n = 5 HDs), or PCI-15B plus NK-cells (n = 5 HDs). A 2-way ANOVA test was performed to identify statistical differences (****p < 0.0001). (c), Representative dot plots showing gated DAPI+ HLA-DR+ DCs by treatment and co-culture condition. (d), Scatter plots showing percentage DAPI+ HLA-DR+ DCs by treatment and co-culture conditions with tumor cell lines of multiple origin. Tukey’s multiple comparison test was performed to identify statistical differences. Value shows the aggregated replicates for each donor, n = 3. A 2-way ANOVA multiple t-test was performed to evaluate statistical differences. *p < 0.0332, **p < 0.0021.

References

    1. Wu Y, Chen W, Xu ZP, Gu W.. PD-L1 distribution and perspective for cancer immunotherapy-blockade, knockdown, or inhibition. Front Immunol. 2019;10:2022. doi: 10.3389/fimmu.2019.02022. - DOI - PMC - PubMed
    1. Oh SA, Wu DC, Cheung J, Navarro A, Xiong H, Cubas R, Totpal K, Chiu H, Wu Y, Comps-Agrar L, et al. PD-L1 expression by dendritic cells is a key regulator of T-cell immunity in cancer. Nat Cancer. 2020;1(7):681–19. doi: 10.1038/s43018-020-0075-x. - DOI - PubMed
    1. Bournazos S, Wang TT, Dahan R, Maamary J, Ravetch JV. Signaling by antibodies: recent progress. Annu Rev Immunol. 2017;35(1):285–311. doi: 10.1146/annurev-immunol-051116-052433. - DOI - PMC - PubMed
    1. Park JE, Kim SE, Keam B, Park H-R, Kim S, Kim M, Kim TM, Doh J, Kim D-W, Heo DS. Anti-tumor effects of NK cells and anti-PD-L1 antibody with antibody-dependent cellular cytotoxicity in PD-L1-positive cancer cell lines. J Immunother Cancer. 2020;8(2):e000873. doi: 10.1136/jitc-2020-000873. - DOI - PMC - PubMed
    1. Galvez-Cancino F, Simpson AP, Costoya C, Matos I, Qian D, Peggs KS, Litchfield K, Quezada SA. Fcγ receptors and immunomodulatory antibodies in cancer. Nat Rev Cancer. 2024;24(1):51–71. doi: 10.1038/s41568-023-00637-8. - DOI - PubMed

Publication types

MeSH terms

LinkOut - more resources