. 2025 May 14;17(19):28163-28172.
doi: 10.1021/acsami.4c17644. Epub 2025 May 1.

Midtemperature CO2 Deoxygenation to CO over Oxygen Vacancies of Doped CeO2

Affiliations

Midtemperature CO2 Deoxygenation to CO over Oxygen Vacancies of Doped CeO2

Nan-Chian Chiang et al. ACS Appl Mater Interfaces. .

Abstract

CO2 capture and utilization are a must for easing the global warming caused by the use of fossil fuels. Previous studies demonstrate the possibility of thermal deoxygenation of CO2 to CO over the vacancies of CeO2. This study examines the influence of the dopant to CeO2 on the deoxygenation of CO2 to CO, wherein the examined dopants include Zr, Gd, Sm, and In. Only In-doped CeO2 exhibits significant reactivity for CO2 deoxygenation in our sequential temperature-programmed reduction (TPR) and CO2-TPRx (temperature-programmed reaction) tests up to 700 °C. In0.5Ce0.5Oy after H2-TPR demonstrates a deoxygenation onset temperature as low as 400 °C and it can maintain a stable performance in cycle tests. X-ray diffraction (XRD) and X-ray photoelectron spectroscopy (XPS) analyses indicate that In exsolutes from the fluorite framework during TPR and the exsoluted In0 become oxidized in the subsequent CO2 deoxygenation reaction. XPS indicates that the redox of Ce also occurs during TPR-CO2-TPRx with In0.5Ce0.5Oy. In2O3 by itself demonstrates a higher deoxygenation onset temperature, a lower per gram deoxygenation capacity, and a poorer stability than In0.5Ce0.5Oy under the same test conditions, while CeO2 is inactive. The results suggest a synergy between exsoluted In and the fluorite substrate, leading to the observed deoxygenation activity of In-doped CeO2.

Keywords: CO2; CeO2; deoxygenation; dopant; oxygen vacancy.


Conflict of interest statement

The authors declare no competing financial interest.

Figures

Figure 1
Figure 1
X-ray diffraction patterns of selected as-prepared MxCe1–xOy samples in the (a) 20–80° 2θ range and (b) expanded 2θ range revealing the shift in the fluorite(111) peak.
Figure 2
Figure 2
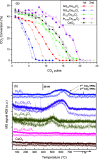
CO2 deoxygenation results of selected samples in 2-cycle tests using (a) an isothermal pulse input of 5% CO2 at 700 °C after the sample was activated by TPR up to 900 °C and (b) TPRx from 50 to 700 °C under a 5% CO2 flow after the sample was activated by TPR up to 700 °C.
Figure 3
Figure 3
Ex situ XPS spectra of selected as-prepared samples: (a) Ce 3d, showing the fitting results of the combination of Ce3+ and Ce4+ (fitting results are shown in Table S2), and (b) In 3d.
Figure 4
Figure 4
Ex situ XPS analysis of In0.5Ce0.5Oy and CeO2 samples at different stages during 2 cycles of the TPR deoxygenation sequential test. (a) Ce 3d, (b) In 3d, (c) O 1s of In0.5Ce0.5Oy, and (d) Ce 3d of CeO2. Fresh: as-prepared, reduced: after 1st TPR, 1 cycle: after 1st TPR and 1st TPRx deoxygenation, and 2 cycle: after 2nd TPR and 2nd TPRx deoxygenation. All XPS data were analyzed after sample cooling to room temperature and then exposure to air.
Figure 5
Figure 5
XRD analysis of CeO2, In0.2Ce0.8Oy, and In0.5Ce0.5Oy samples at different stages during 2 cycles of the TPR deoxygenation sequential test. Fresh: as-prepared, reduced: after 1st TPR, 1 cycle: after 1st TPR (to 700 °C) and 1st TPRx deoxygenation, and 2 cycle: after 2nd TPR and 2nd TPRx deoxygenation. All XRD data were analyzed after sample cooling to room temperature and then exposure to air.
Figure 6
Figure 6
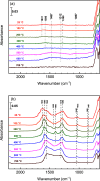
In situ DRIFTS analysis during CO2-TPRx over (a) reduced In0.5Ce0.5Oy and (b) reduced CeO2. Both samples were in line with reduced samples by TPR up to 700 °C. The background spectra were recorded over reduced samples under Ar at the specified temperature of the spectrum.
Figure 7
Figure 7
Mass spectrometry signals during 5 cycles of isothermal CO2 deoxygenation in 5 consecutive cycles of the sequential H2-reduction-CO2-deoxygenation test over In0.5Ce0.5Ox at 700 °C. The “blank” indicates the results in the absence of In0.5Ce0.5Ox (i.e., empty tube).

References

    1. Gao F.-Y.; Bao R.-C.; Gao M.-R.; Yu S.-H. Electrochemical CO2-to-CO conversion: electrocatalysts, electrolytes, and electrolyzers. J. Mater. Chem. A 2020, 8, 15458–15478. 10.1039/D0TA03525D. - DOI
    1. Chueh W. C.; Haile S. M. Ceria as a Thermochemical Reaction Medium for Selectively Generating Syngas or Methane from H2O and CO2. ChemSusChem 2009, 2, 735–739. 10.1002/cssc.200900138. - DOI - PubMed
    1. Chueh W. C.; Falter C.; Abbott M.; Scipio D.; Furler P.; Haile S. M.; Steinfeld A. High-Flux Solar-Driven Thermochemical Dissociation of CO2 and H2O Using Nonstoichiometric Ceria. Science 2010, 330, 1797–1801. 10.1126/science.1197834. - DOI - PubMed
    1. Scheffe J. R.; Steinfeld A. Thermodynamic Analysis of Cerium-Based Oxides for Solar Thermochemical Fuel Production. Energy Fuels 2012, 26, 1928–1936. 10.1021/ef201875v. - DOI
    1. Furler P.; Scheffe J. R.; Steinfeld A. Syngas production by simultaneous splitting of H2O and CO2via ceria redox reactions in a high-temperature solar reactor. Energy Environ. Sci. 2012, 5, 6098–6103. 10.1039/C1EE02620H. - DOI

LinkOut - more resources