Clinical Trial
. 2025 Apr 29;135(12):e181464.
doi: 10.1172/JCI181464. eCollection 2025 Jun 16.

Tebentafusp elicits on-target cutaneous immune responses driven by cytotoxic T cells in uveal melanoma patients

Affiliations
Clinical Trial

Tebentafusp elicits on-target cutaneous immune responses driven by cytotoxic T cells in uveal melanoma patients

Ramon Staeger et al. J Clin Invest. .

Abstract

BACKGROUNDTebentafusp is the first T cell receptor-based bispecific protein approved for clinical use in HLA-A*02:01+ adult patients with unresectable/metastatic uveal melanoma. It redirects T cells toward gp100-expressing target cells, frequently inducing skin-related early adverse events.METHODSThis study investigated immunological and cellular responses using single-cell and spatial analysis of skin biopsies from patients with metastatic uveal melanoma treated with tebentafusp.RESULTS81.8% of patients developed acute cutaneous adverse events, which correlated with improved survival. Multimodal analysis revealed a brisk infiltration of CD4+ and CD8+ T cells, while melanocyte numbers declined. Single-cell RNA-sequencing revealed T cell activation, proliferation, and IFN-γ/cytotoxic gene upregulation. CD8+ T cells colocalized with melanocytes and upregulated LAG3, suggesting potential for combination therapies with tebentafusp. Melanocytes upregulated antigen presentation and apoptotic pathways, while pigmentation gene expression decreased. However, gp100 remained stably expressed.CONCLUSIONSequential skin biopsies enable in vivo pharmacodynamic modeling of tebentafusp, offering insights into immune activation, toxicity, and treatment response. Examining the on-target effects of bispecifics in tissues amenable to longitudinal sampling enhances our understanding of toxicity and therapeutic escape mechanisms, guiding strategies for treatment optimization.FUNDINGCancer Research Foundation, Swiss National Science Foundation (323630_207029, 733 310030_170320, 310030_188450, CRSII5_183478), Iten-Kohaut Foundation, European Research Council no. 882424, University Priority Project Translational Cancer Research of the University of Zurich (UZH), UZH PostDoc grant (K-85810-02-01).

Keywords: Cancer immunotherapy; Dermatology; Melanoma; Oncology; Skin.


Figures
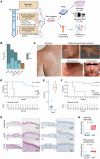
Figure 1
Figure 1. Study overview and characterization of clinical cohort.
(A) Overview of experimental design (created with BioRender). (B) Incidence/grading of cAEs (n = 11). Grading according to CTCAE v5. (C) Representative clinical photographs of cAE observed under tebentafusp. (D) Kaplan-Meier curve of OS grouped by acAE development (log-rank test). (E) Baseline LDH levels grouped by acAE development (n = 11). (F) Kaplan-Meier curve of OS grouped by baseline LDH levels (log-rank test). (G) Representative H&E and CD3 stainings of baseline, acAE, and VLPD samples. (H) Histologic grading of interface dermatitis and perivascular lymphocytes in baseline and acAE (8 patients, paired; Wilcoxon’s test).
Figure 2
Figure 2. Spatial analysis of cutaneous inflammatory infiltrate on tebentafusp.
(A) Representative mIHC scans of baseline, acAE, and VLPD skin samples. (B) Heatmap with scaled marker expression. (C) Cell-type composition at baseline (n = 9), acAE (n = 9), and VLPD (n = 5). Boxplots show the centered log ratio–transformed cell numbers (t test). (D) Epidermal cell sizes at baseline and acAE (n = 3, paired; Cohen’s d = 0.30). (E) Epidermal cell death at baseline and acAE skin samples, shown by TUNEL-positive and -negative epidermal nuclei (n = 5, paired). (F) Representative plot of the spatial distribution of macrophages, CD4+, and CD8+ T cells, relative to epidermis (gray) at baseline, acAE, and VLPD. (G) Spatial density of immune cells relative to melanocytes at baseline (n = 9), acAE (n = 9), and VLPD (n = 5), ranging from 0 μm (most proximal) to 100 μm (most distant) in 10 μm steps. *P < 0.05; ***P < 0.001; ****P < 0.0001.
Figure 3
Figure 3. CTL activation and LAG3 upregulation in response to tebentafusp.
(A) UMAP of T/NK cell subclusters in integrated baseline (1,343 cells) and acAE (1,175 cells) skin samples (n = 3, paired). (B) Marker gene dot plot and (C) cell-type composition bar plot (exact test). (D) Feature scatter plot showing the percentage of CD4+- and CD8A/CD8B-expressing cells. (E) Proliferation index of CD4+ and CD8+ T cells after coculturing with gp100+ cells, with/without gp100-ImmTAC (ANOVA). (F) Violin plot of IFNG expression. (G) Frequency of IFNG-positive CTLs. (H) Boxplot showing the IFN-γ gene signature (100) in T/NK cells (Wilcoxon’s rank-sum test). (I) Dotplot of IFN-γ protein concentrations in the supernatant of T cells cocultured with gp100 peptide–pulsed T2 cells in gp100-ImmTAC presence at different E:T ratios. (J) In vitro activity of tebentafusp against skin melanocytes. PBMCs and CD8+ T cells used as effector cells in IFN-γ and GZMB in ELISpot assays, respectively (t test). (K) Boxplot and (L) feature plot showing the glycolysis gene signature in T/NK cells (Wilcoxon’s rank-sum test). (M) Boxplot of the cytotoxicity signature in T/NK cells (Wilcoxon’s rank-sum test). (N) Violin plot showing the cytotoxic signature expression in T cell subclusters. (O) Violin plot showing IL2RA, LAG3, and PDCD1 in T/NK subclusters (Wilcoxon’s rank-sum test). (P) Chord diagram showing inferred LAG3 signaling in acAE between cell types. (Q) CD25, LAG3, and PD1 protein levels in CD4+ and CD8+ T cells after coculturing with gp100+ cell line at increasing gp100-ImmTAC concentrations (ANOVA). *P < 0.05; **P < 0.01; ***P < 0.001; ****P < 0.0001.
Figure 4
Figure 4. IFN-γ responses and apoptosis in melanocytes.
(A) Volcano plot showing differential gene expression of melanocytes in acAE versus baseline skin samples (cut-offs: P-adj < 0.05, |log2FC| > 0.5) (B) GO pathway enrichment of upregulated genes in melanocytes of acAE versus baseline skin. (C) Bee-swarm plot showing the pigmentation gene signature (101) in melanocytes (Cohen’s d = 0.78) (Wilcoxon’s rank-sum test). (D) Normalized DCT protein levels in melanocytes treated with gp100-ImmTAC coculture supernatant versus control, quantified by WB (n = 3) (t test). (E) Melanin content of melanocytes treated with supernatant derived from gp100-ImmTAC coculture experiments versus control supernatant, quantified by photometric absorbance (n = 2) (t test). (F) Correlation of MITF and DCT expression with CXCL10 in melanocytes (Pearson’s correlation). (G) PMEL expression in baseline and acAE melanocytes. Not significant. (H) Correlation of MITF with PMEL and DCT expression in melanocytes (Pearson’s correlation). (I) Bee-swarm plot showing the apoptosis gene signature (KEGG, in melanocytes) (Cohen’s d = 0.61) (Wilcoxon’s rank-sum test). (J) Barplot showing the effect size (Cohen’s d) and the direction of up- or downregulation of the apoptosis gene signature (102) in acAE versus baseline skin (Wilcoxon’s rank-sum test). (K) Violin plot showing the expression of anti- and proapoptotic genes in melanocytes. (L) Representative cleaved caspase-3 staining and quantification of positive cells in the basal epidermis (n = 5, paired) (t test). SN, supernatant. *P < 0.05; **P < 0.01; ***P < 0.001; ****P < 0.0001.
Figure 5
Figure 5. Network of proinflammatory and immunoregulatory functions in bystander cells.
(A) UMAP of myeloid cell subclusters in integrated baseline (254 cells) and acAE (331 cells) skin samples (n = 3, paired). (B) Marker gene dotplot and (C) cell type composition bar plot of myeloid cell subclusters. Asterisks indicates significantly differentially abundant subclusters. (D) UMAP of keratinocyte subclusters in baseline and acAE skin samples (n = 3, paired). (E) Heatmap of differentially expressed genes in the keratinocytes of acAE versus baseline according to subcluster. Genes are grouped by biological function and significant differences are colored by log2 fold-change. (F) Heatmap of differential interaction strength in cell-cell communication between indicated cell types in acAE versus baseline skin (CellChat). (G) Outgoing and incoming signal strength according to cell type (CellChat). (H) Chord diagram showing the upregulated signaling pathways from melanocytes to other cell types (CellChat). (I) log²fold change of CXCL10 expression in acAE versus baseline skin. (J) Dotplot of CXCL10 protein concentrations in the supernatant of T cells cocultured with gp100 peptide–pulsed T2 cells (gp100 ranging from 0–1000 nM) in gp100-ImmTAC presence (10/100 pM) at different E:T ratios, **P < 0.01.

References

    1. Nathan P, et al. Overall survival benefit with tebentafusp in metastatic uveal melanoma. N Engl J Med. 2021;385(13):1196–1206. doi: 10.1056/NEJMoa2103485. - DOI - PubMed
    1. Oates J, et al. ImmTACs for targeted cancer therapy: Why, what, how, and which. Mol Immunol. 2015;67(2 pt a):67–74. doi: 10.1016/j.molimm.2015.01.024. - DOI - PubMed
    1. Middleton MR, et al. Tebentafusp, A TCR/Anti-CD3 bispecific fusion protein targeting gp100, potently activated antitumor immune responses in patients with metastatic melanoma. Clin Cancer Res. 2020;26(22):5869–5878. doi: 10.1158/1078-0432.CCR-20-1247. - DOI - PMC - PubMed
    1. Lowe KL, et al. Novel TCR-based biologics: mobilising T cells to warm ‘cold’ tumours. Cancer Treat Rev. 2019;77:35–43. doi: 10.1016/j.ctrv.2019.06.001. - DOI - PubMed
    1. Cole D, et al. Abstract 2271: Tebentafusp recognition of melanoma cells is restricted by HLA-A0201 presentation of a gp100 peptide. Cancer Res. 2020;80(16_suppl):2271

Publication types

MeSH terms