. 2025 Jun;301(6):108556.
doi: 10.1016/j.jbc.2025.108556. Epub 2025 Apr 29.

Hepatic ChREBP reciprocally modulates systemic insulin sensitivity in NAFLD

Affiliations

Hepatic ChREBP reciprocally modulates systemic insulin sensitivity in NAFLD

Aniket Sen et al. J Biol Chem. 2025 Jun.

Abstract

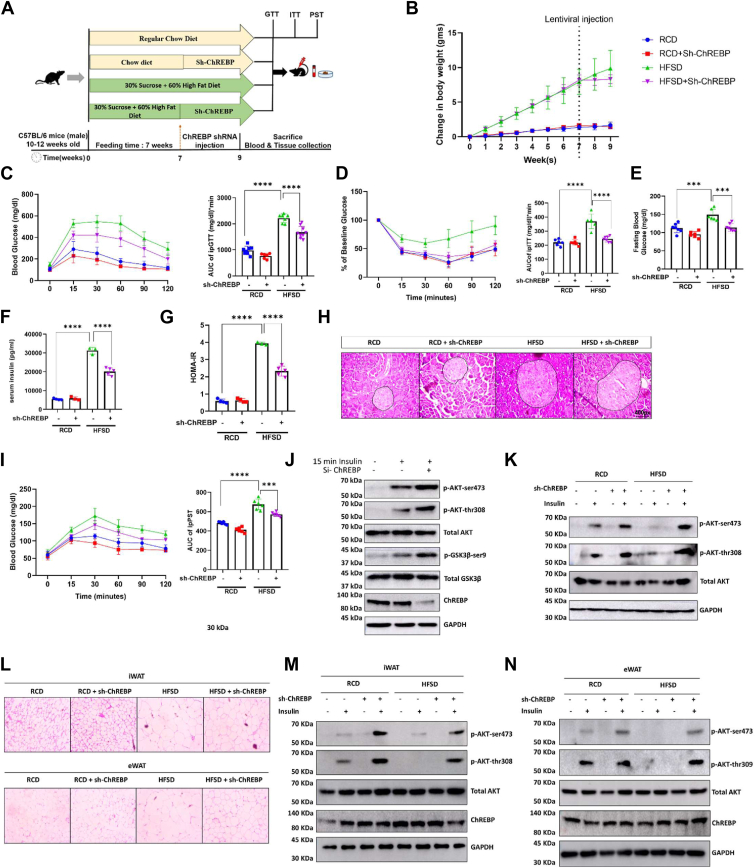
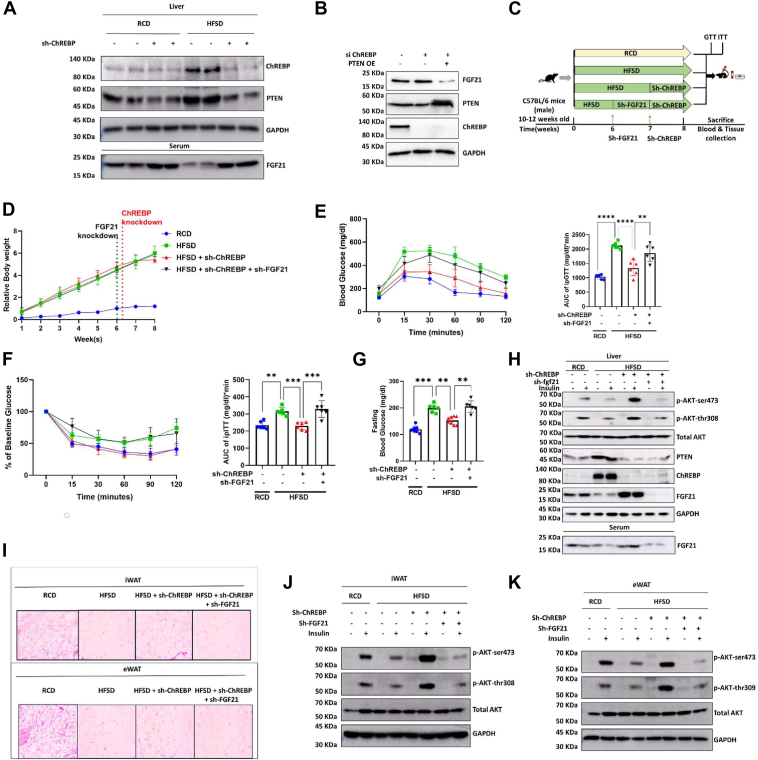
The relation between hepatic ChREBP level and insulin sensitivity remains equivocal. Our study, however, provides compelling evidence that hepatic ChREBP depletion can significantly enhance insulin sensitivity in high-fat and sucrose-fed mice. We have identified that transcriptional induction of hepatic PTEN is driven by ChREBP. Mechanistically, two critical stimuli are elicited in the hepatic ChREBP knockdown condition. The PTEN level is reduced for one stimulus, thereby promoting hepatic insulin sensitivity. The second stimulus, where reduced hepatic PTEN leads to the enhanced release of FGF21, spreads systemic insulin sensitivity. These findings identify hepatic ChREBP as a critical modulator of systemic insulin signaling and suggest that ChREBP downregulation may lead to protection against insulin resistance. Building on this, our molecular dynamics simulation analysis has led to the discovery of a small molecule, Quercetin, that sequesters ChREBP in the cytosol. We report that Quercetin treatment can sequester ChREBP in the cytosol and abrogate high-fat and sucrose-fed-mediated ChREBP nuclear translocation, thereby mimicking the insulin-sensitizing abilities of the hepatic ChREBP knockdown condition. These findings have significant therapeutic implications, suggesting that liver-selective downregulation of ChREBP could protect against systemic insulin resistance that frequently develops early in the pathogenesis of NAFLD and T2DM.

Keywords: ChREBP; FGF21; PTEN; Quercetin; insulin sensitivity.


Conflict of interest statement

Conflicts of interest The authors declare that they have no conflicts of interests with the contents of this article.

Figures

Figure 1
Figure 1
Hepatic ChREBP knockdown improves systemic as well as hepatic glucose homeostasis in HFSD-induced obese mouse models by enhancing insulin sensitivity.A, study plan for the knockout mice study in regular chow diet injected with scramble shRNA (RCD+shScr), ChREBP knockdown in RCD (RCD+shChREBP), 60% fat & 30% sucrose diet–fed mice injected with scramble shRNA (HFSD+shScr) and ChREBP knockdown in HFSD (HFSD+shChREBP). B, plot of the change in the body weight of mice from groups described in (A) before and after lentiviral injection. C and D, plot and area under the curve for glucose and insulin tolerance tests after 6 h of fasting for all four groups. E, plot of 6-h fasting blood glucose. F, plot of the serum insulin levels. G, plot showing changes in HOMA-IR, calculated from overnight fasting glucose levels and serum insulin levels. H, qualitative H&E staining of a pancreas image taken at 40× magnification. I, pyruvate stimulation test after overnight fasting. J, immunoblot images and quantification of phosphorylated AKT (serine 473) and AKT (threonine 308), total AKT, phosphorylated GSK (serine 9) and GSK, ChREBP, and GAPDH (used as a loading control). K, immunoblot images and quantification of phosphorylated AKT (serine 473), phosphorylated AKT (threonine 308), total AKT, phosphorylated insulin receptor beta tyrosine (1150), total insulin receptor beta, ChREBP, and GAPDH (used as a loading control) from liver lysates of the described mouse groups. L, H&E staining of iWAT and eWAT; image captured in 10× magnification showing hyperplasia and adipocyte size. M and N, immunoblot images and quantification of phosphorylated AKT (serine 473), phosphorylated AKT (threonine 308), total AKT, ChREBP, and GAPDH (used as loading control), from iWAT and eWAT lysates respectively, of the mice groups described in (A). (J) is in vitro HepG2 cells, and all other images are from in vivo C57BL6 mice models. Mean ± SD. ∗∗∗p < 0.001, ∗∗∗∗p < 0.0001.
Figure 2
Figure 2
Hepatic ChREBP deficiency improves insulin sensitivity in DIO mice directly by reducing PTEN expression.A, immunoblot images and quantification of ChREBP and PTEN from the liver lysates of all the mice groups discussed in Figure 1A, quantified against GAPDH as the loading control (GAPDH used in Figure 1K is reused for this blot because the data is from same blot and has the same protein quantification). B, immunoblot images and quantification of ChREBP and PTEN, quantified against GAPDH, from liver lysates of mice fed with RCD and 60% high fat diet only (HFD) for 6 weeks. C, immunoblot images and quantification of ChREBP and PTEN, quantified against GAPDH, from liver lysates of ob/ob mice against control C57BL/6 mice fed with RCD. D, schematic portrayal of PTEN promoter cloned in pGL3 vector having ChORE sequence and the ChORE deletion mutant. E, plot of the luciferase assay done in HepG2 cells at low (5 mM) and high (30 mM) glucose concentration after cloning the luciferase construct as shown in (D). F, ChIP analysis done in HepG2 cells for PTEN promoter occupancy upon low and high glucose concentration after pulling down with ChREBP antibody. G, plot of the luciferase assay at low (5 mM) and high (30 mM) glucose concentration, upon transfection with the WT and MUT into HepG2 cells. H, immunoblot image and quantification of PTEN upon ChREBP knockdown in HepG2 cells, quantified with GAPDH as the loading control. I, immunoblot image of PTEN upon ChREBP overexpression and knockdown in low and high glucose concentration in HepG2 cells. J, immunoblot images and quantification of ChREBP and PTEN in fasting (24 h) and refeeding (24 h) mice liver lysates from mice feeding on RCD and HFSD. K, immunoblot images and quantification of ChREBP and PTEN in fasting (24 h) and refeeding (24 h) mice liver lysates of mice given scramble shRNA (HFSD+shScr) versus mice with HFSD+shChREBP. D–I, are from in vitro HepG2 cells, and all other are from in vivo C57BL6 mice models. Mean ± SD. ∗∗p < 0.01, ∗∗∗∗p < 0.0001.
Figure 3
Figure 3
ChREBP-dependent systemic insulin sensitivity is controlled by FGF21.A, immunoblot image and quantification of PTEN, ChREBP, and FGF21 from the liver lysates of the mouse groups described in Figure 1A were quantified with GAPDH as a loading control. B, immunoblot images of FGF21, PTEN, ChREBP, and loading control GAPDH in ChREBP knockdown and PTEN overexpression conditions in 3T3L1 cells. C, study plan for the knockdown mice study in regular chow diet injected with scramble shRNA (RCD+shScr), 60% fat & 30% sucrose diet–fed mice injected with scramble shRNA (HFSD+shScr), ChREBP knockdown in HFSD (HFSD+shChREBP), and ChREBP+FGF21 knockdown in HFSD (HFSD+shChREBP+sh FGF21). D, relative body weight of all the groups before and after sh-RNA injections. E and F, plot and area under the curve for glucose and insulin tolerance tests after 6 h of fasting for all four groups. G, plot of 6-h fasting blood glucose. H, immunoblot images and quantification of phosphorylated AKT serine (473), phosphorylated AKT threonine (308), total AKT, PTEN, FGF21, ChREBP, and GAPDH (used as loading control) from liver of the mice groups as in (C). I, H&E staining of iWAT and eWAT; image captured in 10× magnifications showing hyperplasia and adipocyte size. J and K, immunoblot images and quantification of phosphorylated AKT (serine 473), phosphorylated AKT (threonine 308), total AKT, ChREBP, and GAPDH (used as loading control) from iWAT and eWAT lysates respectively, of the mice groups described in (C). C, is from in vitro 3T3-L1 cells, and rest of the figures are from in vivo C57BL6 mice models. Mean ± SEM. ∗∗p < 0.01, ∗∗∗p < 0.001, ∗∗∗∗p < 0.0001.
Figure 4
Figure 4
Quercetin binds to ChREBP and enhances DIO-induced systemic and hepatic insulin sensitivity by downregulating PTEN through the cytosolic sequestration of ChREBP.A, structure of the sorcin–ChREBP–QH complex, showing QH interaction with both proteins. B, electrostatic potential map of the sorcin–ChREBP–QH complex. C, study plan for Quercitrin administration in regular chow diet (RCD), 60% fat & 30% sucrose diet–fed mice (HFSD), and Quercitrin administration in HFSD (HFSD+QH). D, relative change in mice body weight before and after QH administration. E and F, plot and area under the curve for glucose and insulin tolerance tests after 6 h of fasting for all four groups. G, plot of 6-h fasting blood glucose. H, immunoblot images and quantification of phosphorylated AKT (serine 473), phosphorylated AKT (threonine 308), total AKT, phosphorylated GSK (serine 9), total GSK, and GAPDH (used as a loading control) from liver lysates. I, immunoblot images from nuclear cytosolic fractionation of liver lysates probed for ChREBP, tubulin (as cytosolic control), and Lamin ac (as nuclear control) from the described mice groups. J, immunoblot images of ChREBP, PTEN, and GAPDH (as loading control) from liver lysates of the mice. All experiments in this figure were conducted in vivo using C57BL/6 mice. Mean ± SD. ∗∗p < 0.01, ∗∗∗p < 0.001, ∗∗∗∗p < 0.0001.

References

    1. Zhao Y., Zhang P., Lee J.T., Oldenburg B., van Heusden A., Haregu T.N., et al. The prevalence of metabolic disease multimorbidity and its associations with spending and health outcomes in middle-aged and elderly Chinese adults. Front. Public Heal. 2021;9:658706. - PMC - PubMed
    1. Choubey A., Girdhar K., Kar A.K., Kushwaha S., Yadav M.K., Ghosh D., et al. Low-dose naltrexone rescues inflammation and insulin resistance associated with hyperinsulinemia. J. Biol. Chem. 2020;295:16359–16369. - PMC - PubMed
    1. Rawat P., Thakur S., Dogra S., Jaswal K., Dehury B., Mondal P. Diet-induced induction of hepatic serine/threonine kinase STK38 triggers proinflammation and hepatic lipid accumulation. J. Biol. Chem. 2023;299:104678. - PMC - PubMed
    1. Herman M.A., Peroni O.D., Villoria J., Schön M.R., Abumrad N.A., Blüher M., et al. A novel ChREBP isoform in adipose tissue regulates systemic glucose metabolism. Nature. 2012 doi: 10.1038/nature10986. - DOI - PMC - PubMed
    1. Tang Y., Wallace M., Sanchez-Gurmaches J., Hsiao W.Y., Li H., Lee P.L., et al. ARTICLE Adipose tissue mTORC2 regulates ChREBP-driven de novo lipogenesis and hepatic glucose metabolism. Nat. Commun. 2016 doi: 10.1038/ncomms11365. - DOI - PMC - PubMed

MeSH terms

Substances