. 2025 May 1;23(1):210.
doi: 10.1186/s12964-025-02215-x.

Head and neck squamous cell carcinoma-derived extracellular vesicles mediate Ca²⁺-dependent platelet activation and aggregation through tissue factor

Affiliations

Head and neck squamous cell carcinoma-derived extracellular vesicles mediate Ca²⁺-dependent platelet activation and aggregation through tissue factor

Tobias Weiser et al. Cell Commun Signal. .

Abstract

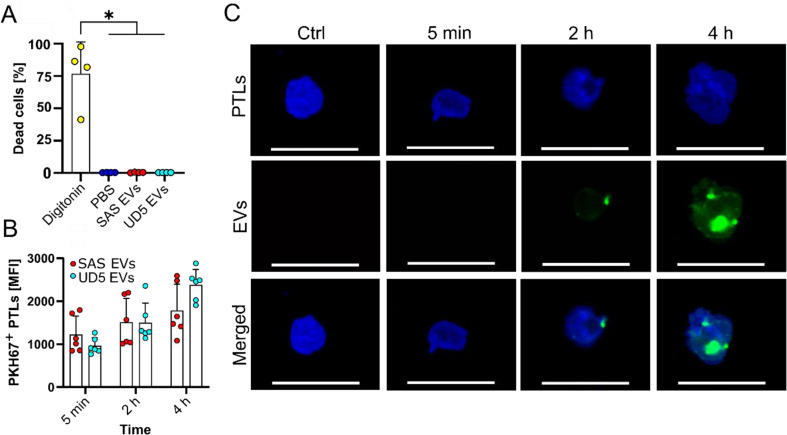
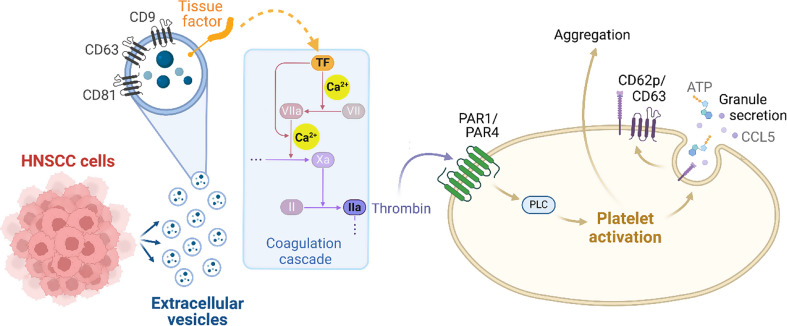
Background: Head and neck squamous cell carcinoma (HNSCC) is an aggressive malignancy, characterized by poor clinical outcomes, primarily driven by high rate of locoregional recurrence and metastasis. Extensive heterogeneity among the tumor cells as well as modulation of a highly immunosuppressive tumor microenvironment shape cancer progression. Shedding of extracellular vesicles (EVs) derived from tumor cells is a critical mediator of the disease initiating horizontal transfer of tumor components into platelets. This triggers platelet activation and thromboinflammation fueling tumor progression through multiple mechanisms.

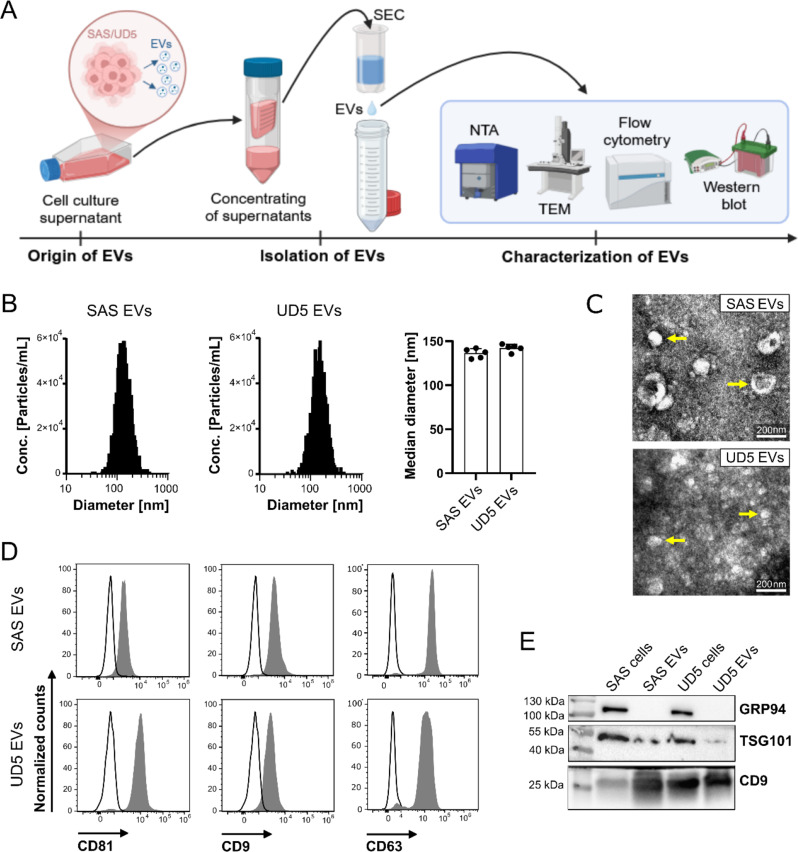
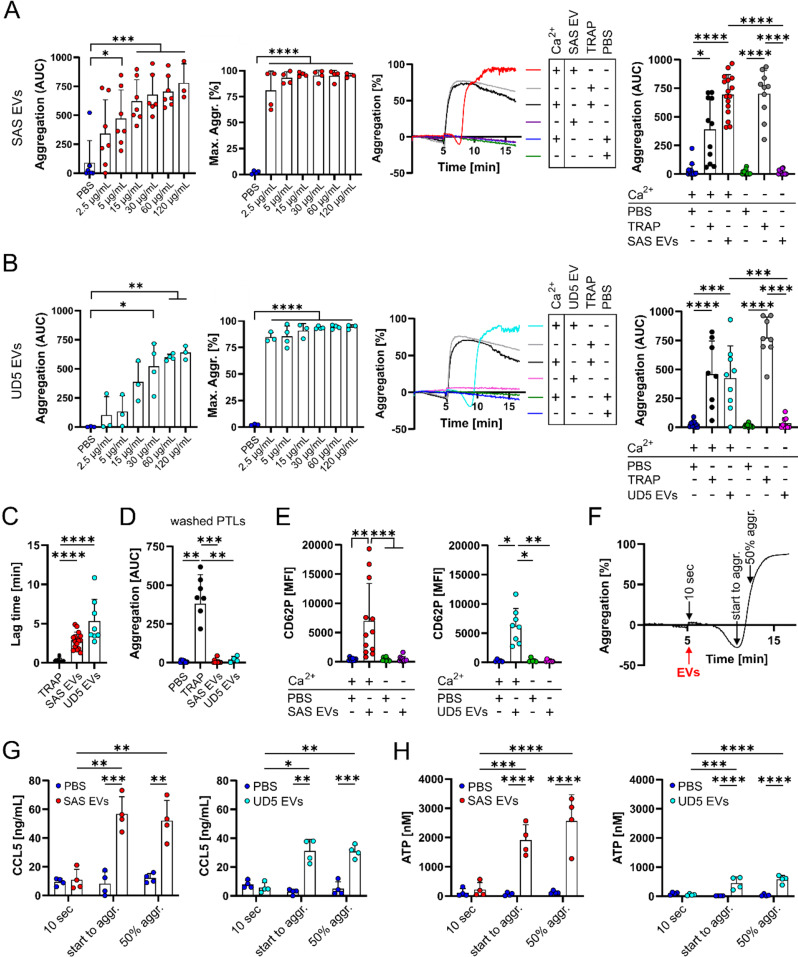
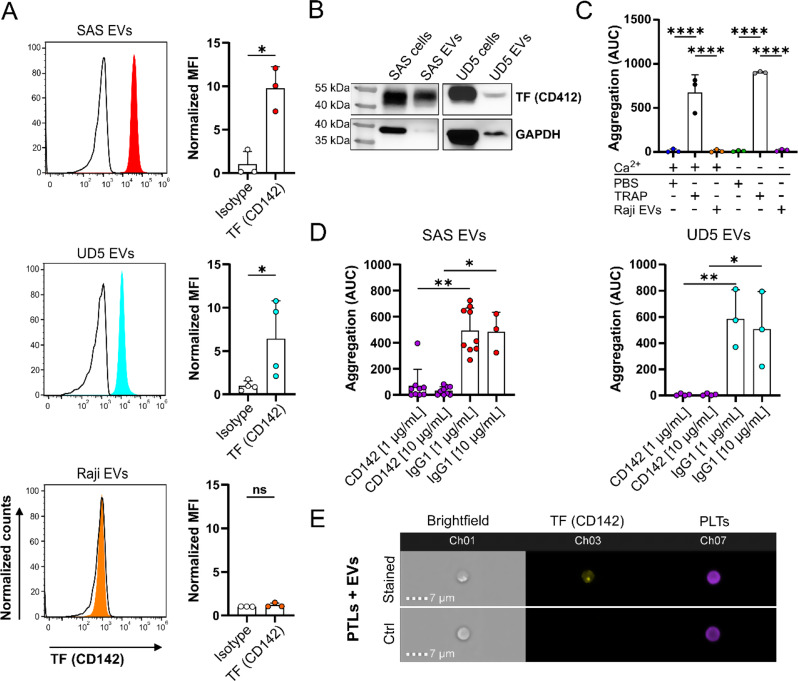
Methods: HNSCC-derived EVs isolated from HNSCC cell lines (SAS, UD-SCC 5) using size exclusion chromatography and characterized via flow cytometry, electron microscopy, nanoparticle tracking analysis and Western blotting, were used to induce platelet activation and aggregation, measured by aggregometry, flow cytometry, as well as the release of chemokines and Adenosine triphosphate, which were quantified using enzyme-linked immunosorbent assays (ELISA). Mechanistic investigations included inhibitor assays, thrombin activity measurements, and proteomic analyses.

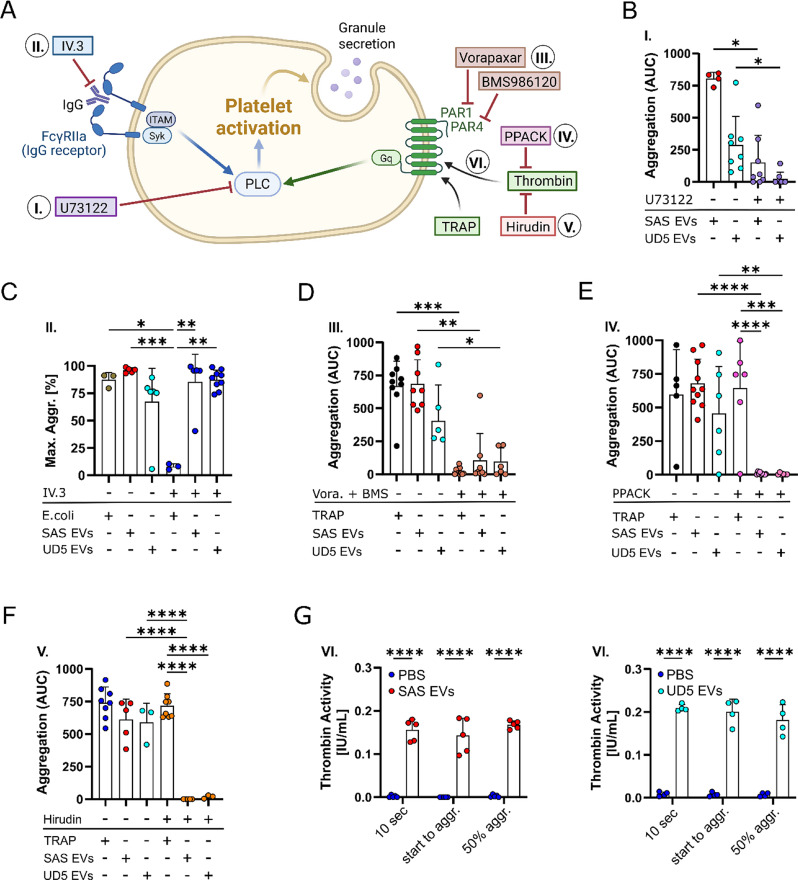
Results: We could show that EVs do not activate platelets through the FcγRIIa-IgG axis but platelet activation and aggregation is induced in a calcium-dependent manner, primarily mediated by EV-associated tissue factor. Proteomic analysis confirmed the presence of tissue factor in these vesicles, implicating its involvement in initiating the coagulation cascade, that leads to platelet activation and aggregation. This process was characterized by delayed aggregation kinetics and relied on thrombin activation, as the inhibition of thrombin and its receptors reduced platelet aggregation. HNSCC-derived EVs are pivotal in establishing a prothrombotic environment by promoting platelet activation and aggregation through tissue factor-dependent thrombin generation.

Conclusion: These findings indicate a therapeutic potential of targeting EV-mediated pathways as a therapeutic approach to alleviate thrombotic complications in HNSCC patients. Subsequent animal studies will be crucial to validate and extend these observations, providing deeper insight into their clinical implications.

Keywords: Cancer-associated thrombosis; Coagulation cascade; Extracellular vesicles; Head and neck squamous cell carcinoma; Platelet activation; Tissue factor.


Conflict of interest statement

Declarations. Ethics approval and consent to participate: This study was approved by the local ethics committee of the Technical University of Munich (protocol numbers: 2020 − 474_2-S-NP and 2022-211-S-NP). All donors provided informed consent in compliance with the Declaration of Helsinki. Donors were self-reported as healthy and confirmed they had not taken antithrombotic medication for at least 7 days prior to blood donation. Competing interests: The authors declare no competing interests.

Figures

Fig. 1
Fig. 1
Characterization of EVs isolated from HNSCC cell lines. EVs were isolated from the cell culture supernatant of SAS and UD5 cells using Exo-spin™-based size exclusion chromatography (SEC). (A) Schematic overview of the EV isolation and characterization process. This graph was created using BioRender.com. (B) Size distribution profiles of the isolated EVs as determined by NTA. The bar chart illustrates the median size of SAS and UD5 EVs (n = 5 independent NTA analyses). (C) Representative TEM images displaying the morphological characteristics of the EVs. The scale bars (white) are 200 nm. (D) Representative flow cytometric histograms of typical EV surface markers (gray-shaded histograms) using fluorescein isothiocyanate (FITC)-conjugated tetraspanins (CD9, CD63, CD81) monoclonal antibodies. Their respective isotype-matched mAbs were used as negative controls (black line/empty histograms). (E) Representative Western blot images of EV (CD9 and TSG101) and cellular (GRP94) markers from SAS and UD5 whole cell and respective cell culture-derived EV protein lysates. 20 µg of lysates were loaded per lane. The molecular weight markers (in kDa) provide size references, indicating the molecular weights of CD9 (~ 25 kDa), TSG101 (~ 44 kDa) and GRP94 (~ 100 kDa)
Fig. 2
Fig. 2
Ca2+-dependent induction of PLT aggregation and activation by HNSCC-derived EVs. (A) PLT aggregometry following exposure to SAS-derived EVs at varying concentrations. PLT aggregation was measured using an aggregometer. After a 300-second baseline stirring period, EVs were added at 2.5, 5, 15, 30, 60, and 120 µg/mL concentrations. PLT aggregation was continuously monitored for 1000 s. PBS, the elution buffer used during SEC for EV isolation, was a negative control. The first graph quantifies aggregation as the area under the curve (AUC) for each condition (n = 3–7). The second bar graph illustrates the percentage of maximal PLT aggregation observed within 1000 s across varying concentrations of SAS-derived EVs (n = 3–4). The third graph shows representative light transmission aggregation curves for PLTs exposed to 60 µg/mL SAS EVs, TRAP (positive control (ctrl) to induce aggregation) and PBS in Tyrode’s buffer, either with 2 mM Ca²⁺ (+) or without Ca²⁺ (-). The fourth graph presents an AUC-based quantitative PLT aggregation analysis, after treatment with SAS EVs (60 µg/mL) or PBS and TRAP as controls (n = 9–11). (B) PLT aggregometry following exposure to UD5-derived EVs at varying concentrations. PLT aggregation was measured using an aggregometer. After a 300-second baseline stirring period, EVs were added at 2.5, 5, 15, 30, 60, and 120 µg/mL concentrations. PLT aggregation was continuously monitored for 1000 s. PBS, the elution buffer used during SEC for EV isolation, was a negative control. The first graph quantifies aggregation as the area under the curve (AUC) for each condition (n = 3–4). The second bar graph illustrates the percentage of maximal PLT aggregation observed within 1000 s across varying concentrations of UD5-derived EVs (n = 3–4). The third graph shows representative light transmission aggregation curves for PLTs exposed to 60 µg/mL UD5 EVs, TRAP (positive ctrl to induce aggregation) and PBS in Tyrode’s buffer, either with 2 mM Ca²⁺ (+) or without Ca²⁺ (-). The fourth graph presents an AUC-based quantitative PLT aggregation analysis, after treatment with UD5 EVs (60 µg/mL) or PBS and TRAP as controls (n = 8–10). (C) Lag time analysis of PLT aggregation induced by SAS- and UD5-derived EVs (n = 8–13) compared to TRAP (positive ctrl). (D) Measurement of aggregation potential in triple-washed PLTs after addition of SAS and UD5 EVs (60 µg/mL), PBS or TRAP (n = 4–11). (E) Flow cytometric analysis of PLT activation using CD62P as a marker. The graph shows the mean fluorescence intensity (MFI) values for CD62P expression, indicating PLT activation. PLTs were incubated with SAS- or UD5-derived EVs, or PBS (negative control), in Tyrode’s buffer, with or without 2 mM Ca²⁺ (n = 10–12, left graph; n = 5–8, right graph). (F) Schematic of time points for supernatant collection during PLT-EV coincubation: 10 s after EV addition (10 s), at the onset of aggregation (start to aggr.), and 50% of maximum aggregation (50% aggr.). (G) CCL5 release, measured by ELISA from PLT supernatants collected at specific time points, indicates PLT degranulation following incubation with 60 µg/mL of SAS- or UD5-derived EVs (n = 4). (H) ATP assay conducted on PLT supernatants following incubation with SAS- or UD5-derived EVs (60 µg/mL, n = 4). Data are represented as mean + Standard deviation (SD), with statistical significance generally denoted as follows: *p ≤ 0.05, **p ≤ 0.01, ***p ≤ 0.001, ****p ≤ 0.0001. One-way ANOVA followed by Tukey’s post-hoc test for (A, B) and by Bonferroni’s post-hoc test for (B, third graph). Kruskal-Wallis test followed by Dunn’s post-hoc test for (A, third graph) and (C-E). Mixed Model followed followed by Dunett’s post-hoc test for (B, second and third graph). Two-way ANOVA followed by Tukey’s post-hoc test for (G, H)
Fig. 3
Fig. 3
Toxicity evaluation and time-dependent uptake of EVs by PLTs. (A) Assessment of PLT viability using Zombie Violet live-dead staining. PLTs were incubated with 60 µg/mL EVs in Tyrode’s buffer without Ca2+. Digitonin (80 µM) and PBS-treated groups were used as controls. PLTs treated with EVs and lacking Zombie violet staining were used to establish gating parameters. The graph represents the percentage of Zombie violet-positive (dead) cells. Data are presented as mean + SD. Statistical significance is indicated as follows: *p < 0.05 (n = 4), determined using a One-way ANOVA followed by Tukey’s post-hoc test. (B) Quantification of PLT-EV interactions was performed using flow cytometry. PLTs were incubated with 60 µg/mL of PKH67-labeled SAS- and UD5-derived EVs in Tyrode’s buffer without Ca2+ supplementation, and the PKH67 fluorescence intensity was measured in 5 min, 2 h and 4 h post-co-culture. Following staining with CD41-BV421 antibody, PKH67-positive PLTs were quantified. (C) Representative confocal microscopy images of PLTs incubated with PKH67-labeled (green) SAS-derived EVs (60 µg/mL) for 5 min, 2 h and 4 h. PLTs were stained with CD41-BV421 (blue) to visualize PLT morphology. Unlabeled EVs incubated for 4 h served as a control. The scale bar (white) represents 10 μm
Fig. 4
Fig. 4
EV-induced PLT aggregation and activation involve the coagulation cascade. PLTs were suspended in Tyrode’s buffer containing 2 mM Ca2+, and aggregation was monitored for 1000 s. (A) Schematic overview of used PLT aggregation inhibitors and their targets within the PLT activation and aggregation pathways. This graph was created using BioRender.com. (B) Role of phospholipase C (PLC) in EV-induced PLT aggregation. PLTs were pre-incubated with U73122 (10 µM; +; PLC inhibitor), without U73122 (-) or Dimethyl sulfoxide (DMSO; 1:250 dilution; ctrl) for 300 s, followed by the addition of SAS- or UD5 derived EVs (60 µg/mL). PLT aggregation was quantified as the area under the curve (AUC, n = 4–8). (C) Effect of FcγRIIa inhibition on PLT aggregation. PLTs were pre-incubated with (+) or without (-) the FcγRIIa-blocking antibody IV.3 (300 ng/mL) for 300 s in an aggregometer. IgG-coated E. coli (5 × 10⁷ bacteria/sample) or SAS and UD5 EVs (60 µg/mL) were then added to assess FcγRIIa-dependent PLT activation (n = 3–9). (D) Involvement of PAR1 and PAR4 thrombin receptors in EV-induced PLT aggregation. PLTs were pre-treated with Vorapaxar (+; Vora.; 10 µM; PAR1 inhibitor) and BMS986120 (+; BMS; 10 µM; PAR4 inhibitor) or vehicle control (-; DMSO, 1:250 dilution) for 300 s, followed by the addition of SAS or UD5-derived EVs (60 µg/mL). Thrombin receptor activation was induced using TRAP (25 µM; thrombin receptor agonist) as a positive control (n = 5–11). (E) PLTs were treated with the inhibitor PPACK (+, 1 µM) or DMSO control (-, 1:20,000 dilution) to block thrombin activity, and aggregation was assessed following stimulation with SAS and UD5 EVs (60 µg/mL) or TRAP (25 µM; positive control) (n = 5–10). (F) PLT aggregation following treatment with the thrombin inhibitor hirudin (+, 2.5 µM) or H2O control (-, 1:200 dilution) was measured after stimulation with SAS and UD5 EVs (60 µg/mL) or TRAP (25 µM) (n = 3–8). (G) Thrombin activity during PLT aggregation. Thrombin activity (IU/mL) was measured at 10 s, the start of aggregation, and at 50% aggregation. PLTs were incubated with SAS- or UD5-derived EVs (60 µg/mL), and supernatants were collected for analysis. PBS-treated PLTs served as controls (n = 5, left graph; n = 4, right graph). Data are presented as the mean + SD from n ≥ 3 independent experiments. Statistical significance: *p < 0.05, **p < 0.01, ***p < 0.001, ****p < 0.0001. Kruskal-Wallis test followed by Dunn’s post-hoc test for (B-D). One-way ANOVA followed by Bonferroni’s post-hoc test for (E, F). Two-way ANOVA followed by Tukey’s post-hoc test for (G)
Fig. 5
Fig. 5
HNSCC EVs promote platelet aggregation through activation of the coagulation cascade mediated by Tissue Factor (CD142). (A) Flow cytometric analysis of TF (CD142) expression on EVs isolated from SAS (n = 3), UD5 (n = 4) and Raji cells (n = 3). The left panels display representative histograms of CD142-PE staining (colored peaks) compared to the matched isotype controls (black lines) from SAS EVs, UD5 EVs and Raji EVs. The data are normalized to mode for comparison. The right panels summarize the MFI of TF expression normalized to the isotype control for each EV-type. (B) Western blot analysis of TF (CD142) protein expression in SAS cells, SAS EVs, UD5 cells and UD5 EVs. The molecular weight markers (in kDa) indicate bands corresponding to TF (~ 47 kDa) and GAPDH (~ 36 kDa, loading control). (C) The effect of Raji-derived EVs on PLT aggregation was evaluated using aggregometry. PLTs were suspended in Tyrode’s buffer containing 2 mM Ca²⁺ (+) or without Ca²⁺ (-), and aggregation was monitored following the addition of Raji-derived EVs (60 µg/mL) at 300 s. TRAP was used as positive control to induce PLT aggregation, while PBS was considered as negative control (n = 3). (D) Inhibition of SAS- and UD5-derived EV-induced PLT aggregation following mAb-mediated blockade of TF (CD142). SAS (n = 3–9) and UD5 EVs (n = 3–4) were first pre-incubated with CD142 mAb (1 µg/mL and 10 µg/mL), and IgG1 as a matched isotype was used as a negative control. The pre-incubated EVs (60 µg/mL) were subsequently added to PLTs in the aggregometer at the 300 s time point. (E) Representative images of TF (CD142) internalization analyzed by Imaging flow cytometry. PLTs were incubated with SAS-derived EVs (60 µg/mL) for 5 min and analyzed across three channels: bright field (Ch01), TF-associated SAS-derived EVs labeled with CD142-PE (yellow, Ch03), and PLTs labeled with CD41-BV421 (purple, Ch07). The interaction between PLTs and EVs was compared to an unstained control. The scale bar (dashed line) is 7 μm. Data are presented as mean + SD. Statistical significance is as follows: ns-p > 0.05, *p < 0.05, **p < 0.01, ****p < 0.0001. Mann-Whitney test for (A, first and third graph) and unpaired Student’s t-test for (A, second graph). One-way ANOVA followed by Tukey’s post-hoc test for (C) and (D, second graph). Kruskal-Wallis test followed by Dunn’s post-hoc test for (D, first graph)
Fig. 6
Fig. 6
Graphical summary of the investigated mechanism - EVs released by HNSCC cells promote PLT activation and contribute to a pro-thrombotic environment. HNSCC cells produce EVs enriched with surface markers such as CD9, CD63, and CD81, as well as TF (CD142). Once released, these EVs interact with plasma components, leading to the production thrombin (factor IIa), potentially via the coagulation cascade. Thrombin then binds to protease-activated receptors (PAR1 and PAR4) on the PLT surface. This interaction initiates intracellular signaling pathways, such as those mediated by phospholipase C, which drive PLT granule secretion. As a result, activated PLTs release pro-inflammatory mediators, such as ATP and CCL5 and express activation markers such as CD62P and CD63 on their surface, further amplifying PLT aggregation and reinforcing the thrombotic environment. This graphical summary was created using BioRender.com

Similar articles

References

    1. Johnson DE, Burtness B, Leemans CR, Lui VWY, Bauman JE, Grandis JR. Head and neck squamous cell carcinoma. Nat Rev Dis Primers. 2020;6(1):92. - PMC - PubMed
    1. Lala M, Chirovsky D, Cheng JD, Mayawala K. Clinical outcomes with therapies for previously treated recurrent/metastatic head-and-neck squamous cell carcinoma (R/M HNSCC): A systematic literature review. Oral Oncol. 2018;84:108–20. - PubMed
    1. Elmusrati A, Wang J, Wang C-Y. Tumor microenvironment and immune evasion in head and neck squamous cell carcinoma. Int J Oral Sci. 2021;13(1):24. - PMC - PubMed
    1. Wang G, Zhang M, Cheng M, Wang X, Li K, Chen J, et al. Tumor microenvironment in head and neck squamous cell carcinoma: functions and regulatory mechanisms. Cancer Lett. 2021;507:55–69. - PubMed
    1. Xu Q, Li X. Tumor-derived extracellular vesicles in the immune microenvironment of head and neck squamous cell carcinoma: foe or future? J Stomatology Oral Maxillofacial Surg. 2024;125(4):101738. - PubMed

MeSH terms