. 2025 May 1;22(1):9.
doi: 10.1186/s12989-025-00622-z.

Brain iron accumulation in neurodegenerative disorders: Does air pollution play a role?

Affiliations

Brain iron accumulation in neurodegenerative disorders: Does air pollution play a role?

Jithin V George et al. Part Fibre Toxicol. .

Abstract

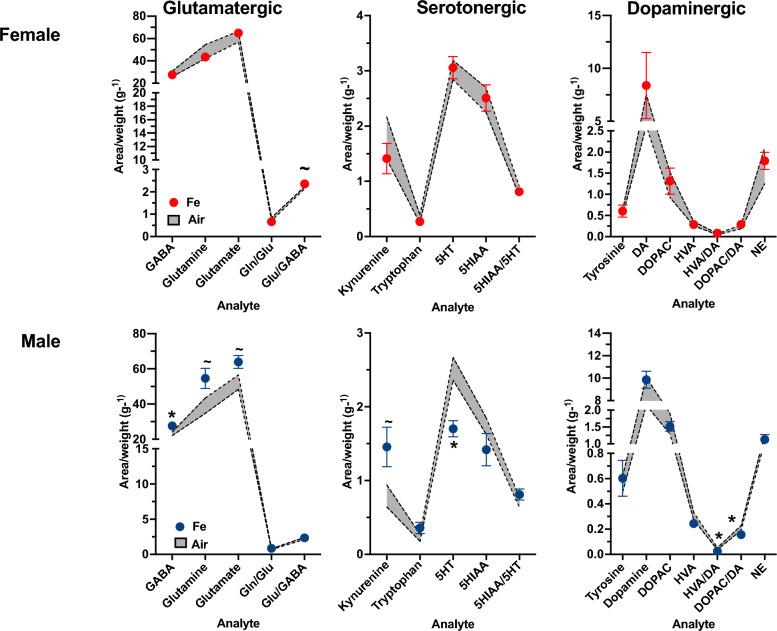
Background: Both excess brain Fe and air pollution (AP) exposures are associated with increased risk for multiple neurodegenerative disorders. Fe is a redox-active metal that is abundant in AP and even further elevated in U.S. subway systems. Exposures to AP and associated contaminants, such as Fe, are lifelong and could therefore contribute to elevated brain Fe observed in neurodegenerative diseases, particularly via nasal olfactory uptake of ultrafine particle AP. These studies tested the hypotheses that exogenously generated Fe oxide nanoparticles could reach the brain following inhalational exposures and produce neurotoxic effects consistent with neurodegenerative diseases and disorders in adult C57/Bl6J mice exposed by inhalation to Fe nanoparticles at a concentration similar to those found in underground subway systems (~ 150 µg/m3) for 20 days. Olfactory bulb sections and exposure chamber TEM grids were analyzed for Fe speciation. Measures included brain volumetric and diffusivity changes; levels of striatal and cerebellar neurotransmitters and trans-sulfuration markers; quantification of frontal cortical and hippocampal Aβ42, total tau, and phosphorylated tau; and behavioral alterations in locomotor activity and memory.

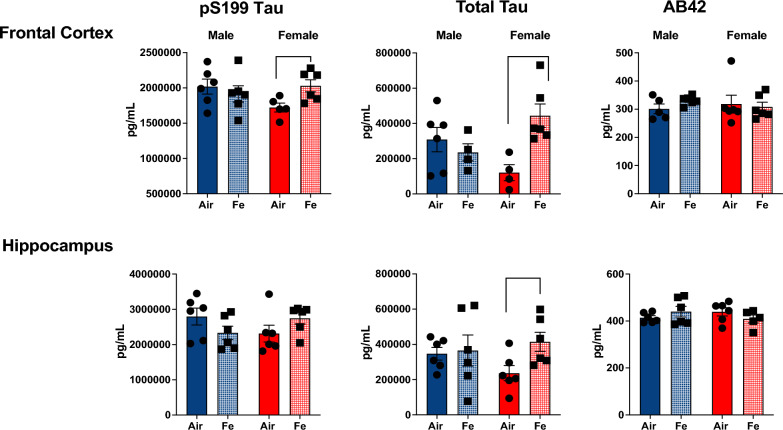
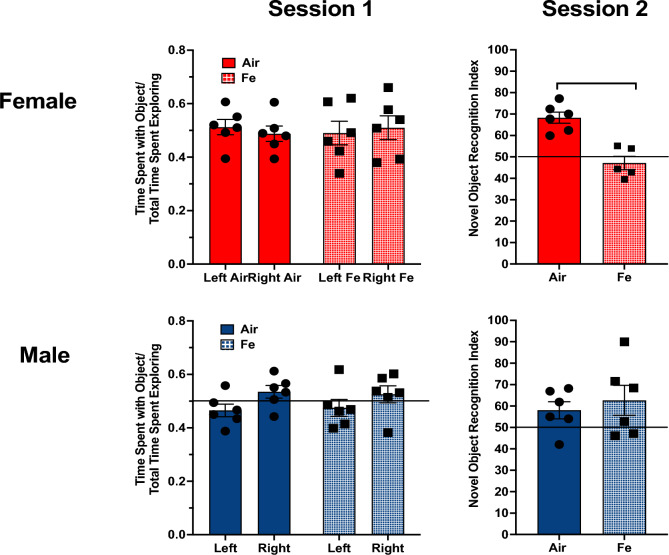
Results: Particle speciation confirmed similarity of Fe oxides (mostly magnetite) found on chamber TEM grids and in olfactory bulb. Alzheimer's disease (AD) like characteristics were seen in Fe-exposed females including increased olfactory bulb diffusivity, impaired memory, and increased accumulation of total and phosphorylated tau, with total hippocampal tau levels significantly correlated with increased errors in the radial arm maze. Fe-exposed males showed increased volume of the substantia nigra pars compacta, a region critical to the motor impairments seen in Parkinson's disease (PD), in conjunction with reduced volume of the trigeminal nerve and optic tract and chiasm.

Conclusions: Inhaled Fe oxide nanoparticles appeared to lead to olfactory bulb uptake. Further, these exposures reproduced characteristic features of neurodegenerative diseases in a sex-dependent manner, with females evidencing features similar to those seen in AD and effects in regions in males associated with PD. As such, prolonged inhaled Fe exposure via AP should be considered as a source of elevated brain Fe with aging, and as a risk factor for neurodegenerative diseases. The bases for dichotomous sex effects of inhaled Fe nanoparticles is as of yet unclear. Also as of yet unknown is how duration of such Fe exposures affect outcome, and/or whether exposures to inhaled Fe during early brain development enhances vulnerability to subsequent Fe exposures. Collectively, these findings suggest that regulation of air Fe levels, particularly in enclosed areas like subway stations, may have broad public health protective effects.

Keywords: Air pollution; Alzheimer’s disease; Iron; Memory; Olfactory bulb; Parkinson’s disease; Substantia nigra; Tau.


Conflict of interest statement

Declarations. Ethics approval and consent to participation: This study was carried out in accordance with relevant guidelines and regulations. All mice used were treated according to protocols approved by the University of Rochester Medical Center Institutional Animal Care and Use Committee and Committee on Animal Resources (approval #102208/2010-046E) and in accordance with NIH guidelines. Consent for publication: Not applicable. Competing interests: The authors declare that they have no competing interests.

Figures

Fig. 1
Fig. 1
Schematic of experimental design. 32 young adult male and 32 young adult female mice were exposed via inhalation to 100 μg/m3 Fe oxide nanoparticles or filtered air for 2 h/day for 5 days/week (M–F) for a total of 20 exposure sessions. Brains were collected from a subset of each sex/treatment group at 2 days post exposure for Fe speciation analyses, magnetic resonance histological analyses and quantification of brain neurotransmitter levels. Six mice from each sex/treatment group were subjected to behavioral testing over approximately 6 months after which brains were collected for determination of neurotransmitter levels and quantification of Aβ42 and Tau
Fig. 2
Fig. 2
a Mean ± standard deviation mass concentrations (μg/m3) and particle counts (#/cm3) of Fe oxide across the 20 exposure sessions. b Mean particle diameter (nm) across the 20 exposure sessions
Fig. 3
Fig. 3
Fe speciation is illustrated using STEM imaging. Box A: TEM Grid Fe Speciation. a STEM image shows Fe3O4 nanoparticle agglomerate with corresponding elemental maps for Fe (b) and O (c). High resolution STEM (d–e) shows polycrystalline Fe3O4 domains and a thin hematite (Fe2O3) rim approximately 1–2 nm wide with low density (red arrows). Electron diffraction patterns are illustrated for magnetite core (f) and hematite rim (g). Box B: Fe nanoparticles identified in olfactory bulb. a Two regions, marked with yellow square, where Fe particles translocated to olfactory bulb. A magnified view is shown in (b) and further magnified in (c–e) with corresponding elemental maps for Fe and O distribution. f STEM image illustrating the location of two isolated exogenous magnetite (Fe3O4) particles near a corpora amylacea body with copious endogenous Fe particle accumulation “ferritin NP”. g–l further magnification of the Fe3O4 that show no Fe2O3 rims. jl ferritin NP at higher magnification in the STEM images with corresponding elemental map for Fe (m). ELLS analysis of ferritin NP of the region marked in j with a yellow square. Correspondingly, Fe3O4 was detected in olfactory bulb from an Fe-exposed brain
Fig. 4
Fig. 4
Group mean ± SE levels of striatal glutamatergic, serotonergic and dopaminergic neurotransmitters (area/weight) (g−1) in female (top row) and male mice (bottom row) exposed to filtered air (Air; gray shaded area) or Fe nanoparticles (Fe; symbols) measured two days post termination of exposure. GABA = gamma aminobutyric acid; Gln = glutamine; Glu = glutamate; Tyr = tyrosine; DA = dopamine; DOPAC = 3,4-dihydroxyphenylacetic acid; HVA = homovanillic acid; NE = norepinephrine; Kyn = kynurenine; Trp = tryptophan; 5HTP = 5-hydroxytryptophan; 5HT = serotonin; 5HIAA = 5-hydroxyindoleacetic acid. * statistically significant at p ≤ 0.05; ~ p value ≤ 0.10
Fig. 5
Fig. 5
Group mean ± standard error levels of glutamatergic, serotonergic and dopaminergic neurotransmitters (area/weight) (g−1) in cerebellum of female (top row) and male mice (bottom row) exposed to filtered air (Air; gray shaded area) or Fe nanoparticles (Fe; symbols) measured two days post termination of exposure. (area/weight) (g−1) in cerebellum of female mice (top row) and male mice (bottom row) exposed to filtered air (Air; gray shaded area) or Fe nanoparticles (Fe; symbols) measured two days post termination of exposure. GABA = gamma aminobutyric acid; Gln = glutamine; Glu = glutamate; Tyr = tyrosine; DA = dopamine; DOPAC = 3,4-Dihydroxyphenylacetic acid; HVA = homovanillic acid; NE = norepinephrine; Kyn = kynurenine; Trp = tryptophan; 5HTP = 5-hydroxytryptophan; 5HT = serotonin; 5HIAA = 5-hydroxyindoleacetic acid. * statistically significant at p ≤ 0.05; ~ p value ≤ 0.10
Fig. 6
Fig. 6
Individual specimen diffusivity values (10−3 × mm2/s) in olfactory bulb of male mice exposed to filtered air (blue circles) or Fe nanoparticles (blue asterisks) and female mice exposed to filtered air (red circles) or Fe nanoparticles (red asterisks) as assessed in dMRI from specimen perfused two days post termination of exposure. * statistically significant at uncorrected p ≤ 0.05 for each diffusivity value grouping. ** statistically significant at uncorrected p ≤ 0.01 for each diffusivity value grouping. Black is significance determined by the 2-Way ANOVA with interactions analysis. Red (female) and Blue (male) indicates significance as determined by the stratified Kruskal Wallis non-parametric ANOVAs
Fig. 7
Fig. 7
Group mean ± standard error levels of phosphorylated tau (left column), total tau (middle column) and Aβ42 (right column) (pg/mL) in frontal cortex (top row) and hippocampus (bottom row) of male (blue) and female (red) mice exposed to filtered air (Air) or Fe nanoparticles (Fe). * indicates statistically significant at p ≤ 0.05
Fig. 8
Fig. 8
Left Column: Group mean ± SE levels of time spent with object/total time spent exploring in session one (left column) of left and right objects in females (top left) and males (bottom left) exposed to filtered air (Air) or to Fe nanoparticles (Fe). Right Column: novel object recognition index in NOR session 2 for males (blue) and females (red) exposed to filtered air (Air) or to Fe nanoparticles (Fe). * indicates statistically significantly different from Air at p ≤ 0.05
Fig. 9
Fig. 9
Top row: Group mean ± standard error of percent errors on the RAM in males (left) and females (right) exposed to filtered air (closed circles) or Fe nanoparticles (open circles) across days of measurement. * indicates statistically significantly different from Air at p ≤ 0.05. Bottom row: Correlation of frontal cortex phosphorylated tau levels (pg/mL) with percent errors during session 3 of RAM in female mice
Fig. 10
Fig. 10
Group mean ± standard error levels of glutamatergic, serotonergic and dopaminergic neurotransmitters (area/weight) (g−1) in striatum of female (top row) and male mice (bottom row) exposed to filtered air (Air; gray shaded area) or Fe nanoparticles (Fe; symbols) measured after behavioral testing. GABA = gamma aminobutyric acid; Gln = glutamine; Glu = glutamate; Tyr = tyrosine; DA = dopamine; DOPAC = 3,4-Dihydroxyphenylacetic acid; HVA = homovanillic acid; NE = norepinephrine; Kyn = kynurenine; Trp = tryptophan; 5HTP = 5-hydroxytryptophan; 5HT = serotonin; 5HIAA = 5-hydroxyindoleacetic acid. * indicates statistically significant at p ≤ 0.05; ~ indicates p value ≤ 0.10
Fig. 11
Fig. 11
Group mean ± standard error levels of glutamatergic, serotonergic and dopaminergic neurotransmitters (area/weight) (g−1) in cerebellum of female (top row) and male mice (bottom row) exposed to filtered air (Air; gray shaded area) or Fe nanoparticles (Fe; symbols) measured after behavioral testing. (area/weight) (g−1) in cerebellum of female mice (top row) and male mice (bottom row) exposed to filtered air (Air; gray shaded area) or Fe nanoparticles (Fe; symbols) measured two days post termination of exposure. GABA = gamma aminobutyric acid; Gln = glutamine; Glu = glutamate; Tyr = tyrosine; DA = dopamine; DOPAC = 3,4-Dihydroxyphenylacetic acid; HVA = homovanillic acid; NE = norepinephrine; Kyn = kynurenine; Trp = tryptophan; 5HTP = 5-hydroxytryptophan; 5HT = serotonin; 5HIAA = 5-hydroxyindoleacetic acid. * indicates statistically significant at p ≤ 0.05; ~ indicates p value ≤ 0.10
Fig. 12
Fig. 12
Group mean ± standard error levels of striatal (top row) and cerebellar (bottom row) transulfuration markers of females (left column) and males (right column) exposed to filtered air (gray shaded area) or to Fe measure at 2 days post exposure (pre) and following behavioral testing (post) including methionine, h-cysteine, cysteine and glutathione (GSH). * statistically significant at p ≤ 0.05; ~ p value ≤ 0.10

References

    1. Baringer SL, Simpson IA, Connor JR. Brain iron acquisition: an overview of homeostatic regulation and disease dysregulation. J Neurochem. 2023. 10.1111/jnc.15819. - PubMed
    1. Benarroch EE. Brain iron homeostasis and neurodegenerative disease. Neurology. 2009;72(16):1436. 10.1212/WNL.0b013e3181a26b30. - PubMed
    1. Dusek P, Hofer T, Alexander J, Roos PM, Aaseth JO. Cerebral iron deposition in neurodegeneration. Biomolecules. 2022;12:5. 10.3390/biom12050714. - PMC - PubMed
    1. Tao Y, Wang Y, Rogers JT, Wang F. Perturbed iron distribution in Alzheimer’s disease serum, cerebrospinal fluid, and selected brain regions: a systematic review and meta-analysis. J Alzheimers Dis. 2014;42(2):679–90. 10.3233/JAD-140396. - PubMed
    1. Connor JR, Menzies SL, St Martin SM, Mufson EJ. A histochemical study of iron, transferrin, and ferritin in Alzheimer’s diseased brains. J Neurosci Res. 1992;31(1):75–83. 10.1002/jnr.490310111. - PubMed