. 2025 May 1;15(1):15285.
doi: 10.1038/s41598-025-00041-2.

Neonatal hypoxia leads to impaired intestinal function and changes in the composition and metabolism of its microbiota

Affiliations

Neonatal hypoxia leads to impaired intestinal function and changes in the composition and metabolism of its microbiota

Jun Wen et al. Sci Rep. .

Abstract

Neonatal hypoxia, a prevalent complication during the perinatal period, poses a serious threat to the health of newborns. The intestine, as one of the most metabolically active organs under stress conditions, is particularly vulnerable and susceptible to hypoxic injury. Using a neonatal hypoxic mouse model, we systematically investigated hypoxia-induced intestinal barrier damage and underlying mechanisms. Hypoxia caused significant structural abnormalities in the ileum and distal colon of neonatal mice, including increased numbers of F4/80+ cells (p = 0.0031), swollen mucus particles (p = 0.0119), and disrupted tight junction. At the genetic level, hypoxia caused dysregulation of the expression of genes involved in intestinal barrier function, including antimicrobial activity, immune response, intestinal motility, and nutrient absorption. Further 16 S rDNA sequencing revealed hypoxia-driven gut microbiota dysbiosis with general reduced microbial abundance and diversity (Chao1 = 0.1143, Shannon = 0.0571, and Simpson = 0.3429). Structural dysbiosis of the gut microbiota consequently perturbed metabolic homeostasis, especially enhancing the activity of glycolipid metabolism. Notably, results showed that hypoxia may interfere with neurotransmitter metabolism, thereby increasing the risk of neurological disorders.

Keywords: Gut microbiota; Intestinal barrier; Intestinal dysfunction; Mice; Neonatal hypoxia.


Conflict of interest statement

Declarations. Competing interests: The authors declare no competing interests. Ethics approval and consent to participate: This study is performed in accordance with relevant guidelines and regulations. All methods are reported in accordance with ARRIVE guidelines.

Figures

Fig. 1
Fig. 1
(A) Diagram for Constructing a Mouse Model of Neonatal Hypoxia. (B) H&E staining of distal colon and ileum tissue and partially enlarged view. The black arrows indicate the goblet cell.
Fig. 2
Fig. 2
Histochemical staining of colon tissue section. (A) Immunohistochemical staining for macrophage marker protein F4/80. (B) Statistical analysis of relative positive area based on the staining in panel. (C) AB-PAS staining, where acidic mucus appears light blue, and glycogen and neutral mucus appear violet. (D) Statistical analysis of mucus granule size based on the staining in panel. (E) Scale bars are indicated in the figures. E. Immunofluorescence staining for the tight junction protein ZO-1.
Fig. 3
Fig. 3
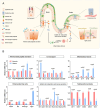
Changes in the transcription levels of the genes are related to the structure and function of the intestinal barrier in the ileum or colon. (A) The schematic diagram of functional genes was created with Microsoft® PowerPoint® 2016MSO (version 2503 Build 16.0.18623.20208). (B) Bar chart of the relative mRNA levels of genes.
Fig. 4
Fig. 4
Analysis of Community Composition of the gut microbiota in mice. (A) UniFrac principal co-ordinate analysis (PCoA) (n = 4). Each point in the figure represents a sample, and points of the same color belong to the same group. The distance between points reflects the similarity between samples. (B) Anosim test result for β-diversity is used to examine whether the differences between groups are significantly greater than the differences within groups, thereby determining the significance of the grouping. (C) Boxplot of α-diversity analysis (Shannon, Simpson, and Chao1 index) is used to assess the richness and diversity of microbial species within samples. (D) Bar chart of the top 10 species in terms of relative abundance at the family level. The horizontal axis represents samples, and the vertical axis represents relative abundance. “Others” indicates the sum of the relative abundances of all families not included in these top10. (E) Five families with significant differences. Values are presented as means ± SEM (n = 4).
Fig. 5
Fig. 5
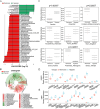
LEfSE (LDA Effect Size), Bugbase and PICRUSt 2 analyses. (A) The LDA score and enriched taxa of the intestinal microbiota after neonatal hypoxia, compared with normoxia. The colors of the bars represent different groups, while the lengths of the bars indicate the LDA scores, reflecting the degree of impact of significantly different species between different groups. (B) The enriched taxa in the control and neonatal hypoxia microbiota are represented through a cladogram. In the evolutionary tree plot, the circles radiating from the inside out represent taxonomic levels from phylum to genus. Each small circle at different taxonomic levels represents a classification at that level, and the diameter of the small circle is proportional to its relative abundance. Coloring principle: Species without significant differences are uniformly colored yellow, while Biomarker species with differences are colored according to their respective groups. Red nodes indicate microbial taxa that play an important role in the red group, and green nodes indicate microbial taxa that play an important role in the green group. The species names represented by English letters are displayed in the legend on the right (for aesthetic purposes, only the different species from phylum to family are displayed by default on the right). Note: The species names represented by English letters are also displayed in the legend at the bottom of the figure. (C) Phenotypic characteristic analysis of Bugbase tool’s prediction. The three lines in the graph, from top to bottom, represent the upper quartile, mean, and lower quartile, respectively. (D) The predicted differences in the KEGG metabolic pathways (Shown top 10). (E) The predicted differences in the GBM (Gut-Brain) metabolic pathways (Shown top 10).

Similar articles

References

    1. Nalivaeva, N. N., Turner, A. J. & Zhuravin, I. A. Role of prenatal hypoxia in brain development, cognitive functions, and neurodegeneration. Front. Neurosci.12, 825. 10.3389/fnins.2018.00825 (2018). - PMC - PubMed
    1. Gale, C. et al. Neonatal brain injuries in England: population-based incidence derived from routinely recorded clinical data held in the National neonatal research database. Arch. Dis. Child. Fetal Neonatal Ed.103, F301–f306. 10.1136/archdischild-2017-313707 (2018). - PMC - PubMed
    1. Graham, E. M. et al. A systematic review of the role of intrapartum hypoxia-ischemia in the causation of neonatal encephalopathy. Am. J. Obstet. Gynecol.199, 587–595. 10.1016/j.ajog.2008.06.094 (2008). - PubMed
    1. Yeh, C. et al. Neonatal dexamethasone treatment exacerbates Hypoxia/Ischemia-Induced white matter injury. Mol. Neurobiol.54, 7083–7095. 10.1007/s12035-016-0241-4 (2017). - PubMed
    1. Greco, P. et al. Pathophysiology of hypoxic-ischemic encephalopathy: a review of the past and a view on the future. Acta Neurol. Belg.120, 277–288. 10.1007/s13760-020-01308-3 (2020). - PubMed

LinkOut - more resources