. 2025 May 2;10(1):140.
doi: 10.1038/s41392-025-02226-7.

Single-cell transcriptomic analysis reveals gut microbiota-immunotherapy synergy through modulating tumor microenvironment

Affiliations

Single-cell transcriptomic analysis reveals gut microbiota-immunotherapy synergy through modulating tumor microenvironment

Minyuan Cao et al. Signal Transduct Target Ther. .

Abstract

The gut microbiota crucially regulates the efficacy of immune checkpoint inhibitor (ICI) based immunotherapy, but the underlying mechanisms remain unclear at the single-cell resolution. Using single-cell RNA sequencing and subsequent validations, we investigate gut microbiota-ICI synergy by profiling the tumor microenvironment (TME) and elucidating critical cellular interactions in mouse models. Our findings reveal that intact gut microbiota combined with ICIs may synergistically increase the proportions of CD8+, CD4+, and γδ T cells, reduce glycolysis metabolism, and reverse exhausted CD8+ T cells into memory/effector CD8+ T cells, enhancing antitumor response. This synergistic effect also induces macrophage reprogramming from M2 protumor Spp1+ tumor-associated macrophages (TAMs) to Cd74+ TAMs, which act as antigen-presenting cells (APCs). These macrophage subtypes show a negative correlation within tumors, particularly during fecal microbiota transplantation. Depleting Spp1+ TAMs in Spp1 conditional knockout mice boosts ICI efficacy and T cell infiltration, regardless of gut microbiota status, suggesting a potential upstream role of the gut microbiota and highlighting the crucial negative impact of Spp1+ TAMs during macrophage reprogramming on immunotherapy outcomes. Mechanistically, we propose a γδ T cell-APC-CD8+ T cell axis, where gut microbiota and ICIs enhance Cd40lg expression on γδ T cells, activating Cd40 overexpressing APCs (e.g., Cd74+ TAMs) through CD40-CD40L-related NF-κB signaling and boosting CD8+ T cell responses via CD86-CD28 interactions. These findings highlight the potential importance of γδ T cells and SPP1-related macrophage reprogramming in activating CD8+ T cells, as well as the synergistic effect of gut microbiota and ICIs in immunotherapy through modulating the TME.


Conflict of interest statement

Competing interests: The authors declare no competing interests. Ethics: Experiments were conducted in compliance with all relevant governmental and institutional guidelines and regulations. All animal procedures were approved by the Institutional Animal Care and Use Committee of West China Hospital, Sichuan University (Approval No. 20220301038).

Figures
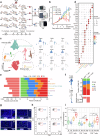
Fig. 1
Fig. 1
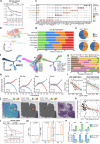
Single-cell profile of TME shaped by the gut microbiota and ICI treatment. a Schematic representation of the experimental design for scRNA-seq and experimental validations across four groups with different treatment strategies. b Line graph depicts the volumetric progression of subcutaneous tumors across four treatment groups. Each group consists of 8 mice (two batches combined). Data are represented as mean ± SEM. c The UMAP projection on the left illustrates cellular subpopulations, with dashed lines demarcating immune and stromal cells. The UMAP on the right highlights the expression of canonical genes for the identified clusters. d Bubble plot indicating the expression patterns of canonical marker genes for cellular clusters. e Bar graph showing the proportional representation of cell types across four groups. f The UMAP on the left highlights the expression of Cd4 and Cd8a in the T cell cluster. The bar graph on the right presents the proportional distribution of CD4+ and CD8+ T cells across four groups. g Multiplex immunofluorescence (mIF) imagery revealing the spatial distribution and abundance of Cd3 labeled T cells across four groups. h Flow cytometric analysis charting the relative abundance of T cells across four groups. I Box-and-whisker plots comparing the flow cytometry determined proportions of CD3+ T cells, CD4+ T cells, and CD8+ T cells across four groups. Each group consists of 4 mice
Fig. 2
Fig. 2
Characterization of subclusters of tumor-infiltrating T cells among different treatment groups. a UMAP visualization delineates the clustering and subtypes of T cells across four groups. b Heatmap illustrates the expression patterns of signature genes associated with T cell subtypes and functions. c Bar chart shows the proportional distribution of T cell subtypes across four groups. d UMAP plot reveals the distribution and proportion of CD8+ Tcm and CD8+ Tex cells across four groups. e Box-and-whisker plot represents the flow cytometry-based proportion of IFN-γ+ T cells across four treatment groups. Each group consists of tumor samples from 4 mice. f Trajectory plot reveals the evolutionary paths and distinct states of CD8+ T cells. g Bar chart indicates the proportions of CD8+ T cells in each state across four groups. h Venn diagram displays the intersecting differentially expressed genes (DEGs) of CD8+ T cells from four groups, with a focus box highlighting 40 DEGs influenced by both gut microbiota and aPD1 treatment in the PW group. i Bubble chart shows significant enriched functional pathways of the 40 DEGs. j Ridge plot depicts the glycolytic levels of CD8+ T cells across four groups. k Violin plot compares the glycolysis levels between the PW group cells and those from the others. l Kaplan–Meier survival curves demonstrate the relationship between cellular glycolytic levels and treatment outcomes in two immunotherapy cohorts
Fig. 3
Fig. 3
Synergistic effects of gut microbiota and ICI treatment on double-negative T (DNT) cells. a Representative mIF images illustrate the abundance of DNT cells (CD3+/CD4/CD8 T cells) within subcutaneous tumors across four groups. b Box plots depict the distribution and median counts of tumor-infiltrating DNT cells in subcutaneous tumors across four groups. Each group comprises four tumor samples, with data collected from two sections per tumor. c Comparison of tumor-infiltrating DNT cells in normobiotic mice with those germ-free counterparts based on GSE181745 dataset. d UMAP visualization delineates the clustering and subtypes of DNT cells. e Bar chart depicts the proportional distribution of DNT cell subtypes across four groups. f Kaplan–Meier survival curves associating tumor-infiltrating γδ T cell abundance with immunotherapy response. g Bubble chart depicts the functional enrichment analysis of gene sets in γδ T cells derived from subcutaneous tumors in the PW group compared to the others. h Heatmap of MHC-I related gene expression in tumor-infiltrating γδ T cells across four groups. i Line graph depicts the volumetric progression of subcutaneous tumors across eight groups. Each group consists of 4 mice. Data are represented as mean ± SEM. j Box-and-whisker plot represents the proportion of T cell subtypes quantified by multiplex immunofluorescence within the subcutaneous tumors of each mouse group, four tumor samples in each group, with data derived from two sections per sample
Fig. 4
Fig. 4
Characterization of myeloid cells and macrophage reprogramming upon ICI treatment. a Kaplan–Meier survival curve demonstrates the correlation of M1/M2 ratio with immunotherapy treatment outcomes in the bladder cancer (BLCA) cohort. b UMAP analysis delineates the clustering and subtypes of myeloid cells. c Bubble plot reveals the expression profiles of marker genes across myeloid cell subtypes. d Bar chart shows the proportional distribution of myeloid subtypes across four groups. e Pie chart shows the proportions of Spp1+ tumor-associated macrophages (TAMs), Cd74+ TAMs and cDC in normobiotic mice with their germ-free counterparts based on GSE181745 dataset. f Trajectory plot reveals the evolutionary paths and distinct states of macrophages/monocytes. g Bar graph shows the proportions of monocyte/macrophage subtypes across 7 evolutionary states. h Line graph reveals loess-regression-smoothened expression of the antigen-presenting (i.e., Cd74 and H2-Aa) and M2-related genes (i.e., Spp1 and Cxcl3) along pseudotime, the region in shade indicates the 95% confidence intervals. i Scatter plot shows the correlation of proportions of SPP1+ TAMs and CD74+ TAMs in two CRC cohorts with public scRNA-seq data. The left plot includes 50 tumor samples from the GSE178341 dataset, while the right plot includes 15 tumor samples from the GSE132465 dataset. j Representative spatial feature plots show the signature score of Immune cells, CD74+ TAMs and SPP1+ TAMs in tumor sections from a CRC patient sample (Qi et al.). k Scatter plot reveals the correlation between signature scores of CD74+ TAMs and SPP1+ TAMs in immune cell-enriched region of the CRC tumor sample in (j). l Kaplan–Meier survival curves demonstrate the correlation of tumor-infiltrating CD74+ TAM/SPP1+ TAM proportion ratio with ICI treatment outcomes in two immunotherapy cohorts. m Box-and-whisker plots showing changes in the proportion of specific TAMs subtypes before and after treatment in the FMT cohort. The left panel represents the proportion of SPP1⁺ TAMs, the middle panel represents CD74⁺ TAMs, and the right panel shows the difference between CD74⁺ TAMs and SPP1⁺ TAMs. NR (non-responders) and R (responders) indicate different response groups to the treatment. The dataset includes a total of nine pairs of samples. n Bar plots illustrating the expression levels of macrophage-associated genes in M1 and M2 macrophages cultured under Akk-conditioned medium (Akk-CM) vs. control medium (Ctrl-Medium). The top row shows Cd74, Il6, and Inos expression in M1 macrophages, while the bottom row represents Cd163, Cd206, and Spp1 expression in M2 macrophages. Statistical significance is conducted with three replicates and indicated as *p < 0.05, **p < 0.01, and ***p < 0.001
Fig. 5
Fig. 5
Synergistic effects of gut microbiota and ICI treatment on SPP1. a Violin plots reveal Spp1 expression levels in myeloid subtypes across four groups. b Forest plot reveals the association between SPP1 gene expression levels and the prognosis of major cancer types in the TCGA dataset. c Kaplan–Meier survival curves show the correlation between SPP1 expression levels and prognosis in two immunotherapy cohorts. d Box plots indicate the levels of osteopontin measured by ELISA in the serum of mice across four groups. Each group consists of 4 mice. e Network diagram illustrates the differential interaction strength of the Spp1-related pathway between two cell types in the PW group compared to the others. f Bubble plot displays the interaction strength of the Spp1-related pathways between tumor-associated macrophages (TAMs)/NK cells and MC38 tumor cells in the PW group compared to the others. g Network diagram shows the differential interaction strength of the Spp1-related pathway between myeloid subtypes and MC38 cells in the PW group compared to the others. h Network diagram illustrates the differential interaction strength of the overall signaling between myeloid subtypes and MC38 cells in the PW group compared to the others
Fig. 6
Fig. 6
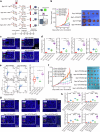
Effects of Spp1 depletion in macrophage on ICI treatment in mouse model. a Schematic representation of the experimental design with ICI/IgG treatment in Spp1-cKO mice compared to Spp1-WT mice. b Line graph (left) depicts the volumetric progression of subcutaneous tumors across four mouse groups from the study depicted in (a). Two batches of experiments were performed with four mice in each group. The image (right) shows the comparison of excised tumors among four groups for one batch. Data are represented as mean ± SEM. c Representation of multiplex immunofluorescence (mIF) images display the staining of T cells and Spp1+ macrophages within the subcutaneous tumors across four groups as shown in (b). d Bar plot quantifies the mIF-based proportions of T cell subtypes within the subcutaneous tumors of the four mouse groups, as shown in (b). Each group comprises four tumor samples except the Spp-cKO/aPD1 group (n = 2 available for mIF), with data collected from two sections per tumor. e Paired cell flow cytometry panel (left) and box plot (right) depict the percentage of apoptotic MC38 cells co-cultured with the spleen-derived T cells across four groups. Each group consists of four mice. f Line graph (left) depicts the volumetric progression of subcutaneous tumors across six ATBs-treated mouse groups with ICI/IgG treatment in Spp1-cKO mice compared to Spp1-WT mice. The image (right) shows the comparison of excised tumors among six groups. Each group consists of four mice. Data are represented as mean ± SEM. g Representation of mIF images reveals the spatial distribution of T cells within the subcutaneous tumors across six groups, as shown in (f). h Bar plot demonstrates the proportions of T cell subtypes in subcutaneous tumors across six mouse groups, as shown in (f). Each group comprises four tumor samples, with data collected from two sections per tumor sample
Fig. 7
Fig. 7
Stimulation of CD8+ T by APCs mediated by γδ T cells. a Volcano plot delineates the differentially expressed genes (DEGs) in macrophages and monocytes from subcutaneous tumors of the PW group compared with those from the others. b Bar graph shows the pathway enrichment analysis of DEGs as shown in (a). c Heatmap presents the expression levels of MHC-II-related genes in antigen-presenting conventional dendritic cells (cDCs) and monocytes/macrophages across four groups. d Schematic graph (left) depicts the key genes in the non-canonical NFκB pathway, the expression of which in cDCs and monocyte/macrophages was illustrated in the heatmap (right) across four mouse groups. Created with BioRender.com. e Violin plot reveals the MAGIC-imputed expression levels of Cd40lg across all cell types. f Network graph portrays the cell interaction strength between different cell types within the Cd40l-Cd40 pathway. g Bubble plot indicates the interaction strength of the Cd40l-Cd40 pathway between γδ T cells and cDCs, monocytes, and macrophage subsets across four groups. h Representative multiplex immunofluorescence (mIF) images (left) illustrate the spatial distribution of interacting Cd40l+ γδ T cells and Cd40+ APCs within the subcutaneous tumors, box plot (right) shows the numbers of interacting Cd40l+ γδ T cells and Cd40+ APC pairs within the subcutaneous tumors across four groups. Each group comprises four tumor samples, with data collected from two sections per tumor. i Network graphs on the left show the differential interaction strength of the Cd86-Cd28 pathway between tumor-infiltrating CD8+ T cells with other cell types in the PW group compared with those in the other three groups; network graphs on the right display the differential interaction strength of the Cd86-Cd28 pathway between tumor-infiltrating CD8+ T cells in Cd40 agonist-treated mice compared to those in control mice. j Bubble plot demonstrates the interaction strength of the Cd86-Cd28 pathway between tumor-infiltrating macrophages/monocytes/cDCs and CD8+ T cells as shown in (i). k Representative mIF images (left) illustrates the spatial distribution of interacting Cd86+ APC and Cd28+Cd8+ T cells within the subcutaneous tumors, box plot (right) shows the numbers of interacting Cd86+ APC and Cd28+Cd8+ T cells pair within the subcutaneous tumors across four groups. Each group comprises four tumor samples, with data collected from two sections per tumor. l Box plot compares the ratio of tumor-infiltrating CD8+ effector memory/central memory T cells to CD8+ exhausted T cells between Cd40 agonist-treated mice (n = 2) and control groups (n = 3). m Pie chart illustrates the ratio of CD8+ effector memory/central memory T cells proportion to CD8+ exhausted T cells across four groups. n Marginal density scatter plot shows the proportion of tumor-infiltrating CD8+ effector memory and γδ T cells in patients from BLCA immunotherapy cohorts. o Scatter plot illustrating the linear correlation between changes in γδ T cell abundance and CD8+ effector & memory T cell abundance before and after FMT. The x-axis represents the change in γδ T cells, while the y-axis represents the change in CD8+ effector & memory T cells, both expressed as percentile rank changes. Density distributions of NR (non-responders, blue) and R (responders, red) groups are shown on the top and right sides of the plot. The dataset includes a total of nine pairs of samples
Fig. 8
Fig. 8
Schematic summary of the synergistic effect of gut microbiota and ICI treatment on macrophage reprogramming and T cell activation via γδT cell-APC-CD8+ T cell axis. TAM tumor-associated macrophage, APC antigen-presenting cells. Created with BioRender.com

Similar articles

Cited by

References

    1. Kim, J. M. & Chen, D. S. Immune escape to PD-L1/PD-1 blockade: seven steps to success (or failure). Ann. Oncol.27, 1492–1504 (2016). - PubMed
    1. Pardoll, D. M. The blockade of immune checkpoints in cancer immunotherapy. Nat. Rev. Cancer12, 252–264 (2012). - PMC - PubMed
    1. Topalian, S. L., Taube, J. M., Anders, R. A. & Pardoll, D. M. Mechanism-driven biomarkers to guide immune checkpoint blockade in cancer therapy. Nat. Rev. Cancer16, 275–287 (2016). - PMC - PubMed
    1. Havel, J. J., Chowell, D. & Chan, T. A. The evolving landscape of biomarkers for checkpoint inhibitor immunotherapy. Nat. Rev. Cancer19, 133–150 (2019). - PMC - PubMed
    1. Yan, X. et al. Prognostic factors for checkpoint inhibitor based immunotherapy: an update with new evidences. Front. Pharmacol.9, 1050 (2018). - PMC - PubMed

MeSH terms

Substances