. 2025 May 1;16(1):4004.
doi: 10.1038/s41467-025-58128-3.

Sex-differentiated placental methylation and gene expression regulation has implications for neonatal traits and adult diseases

Affiliations

Sex-differentiated placental methylation and gene expression regulation has implications for neonatal traits and adult diseases

Fasil Tekola-Ayele et al. Nat Commun. .

Abstract

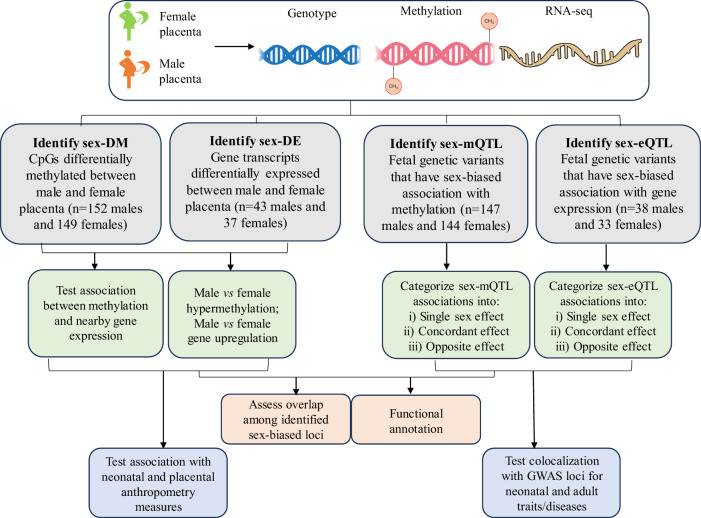
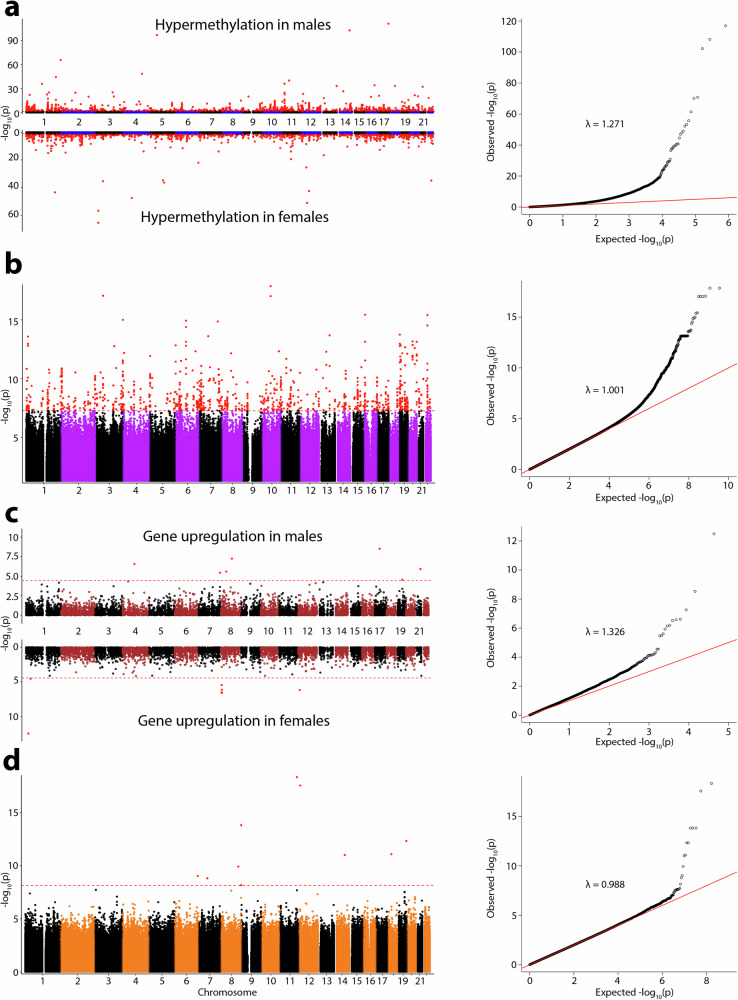
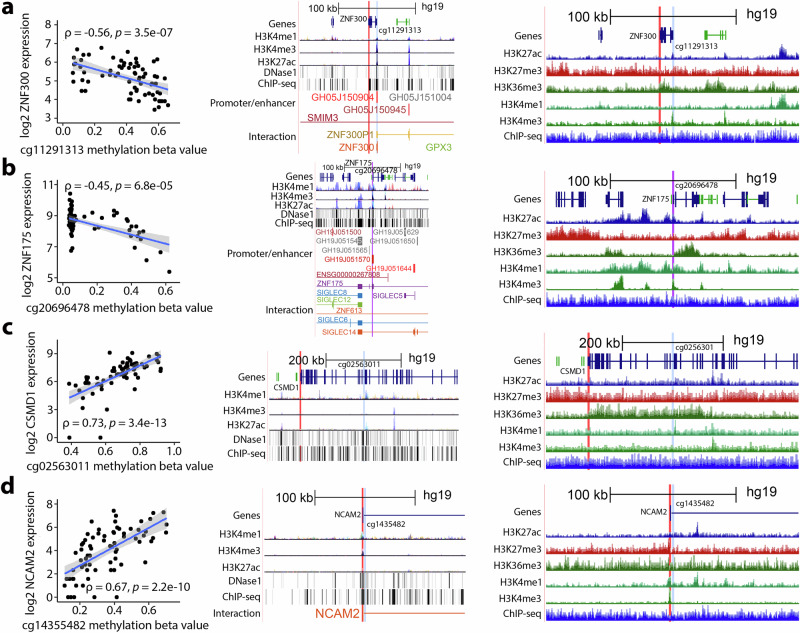
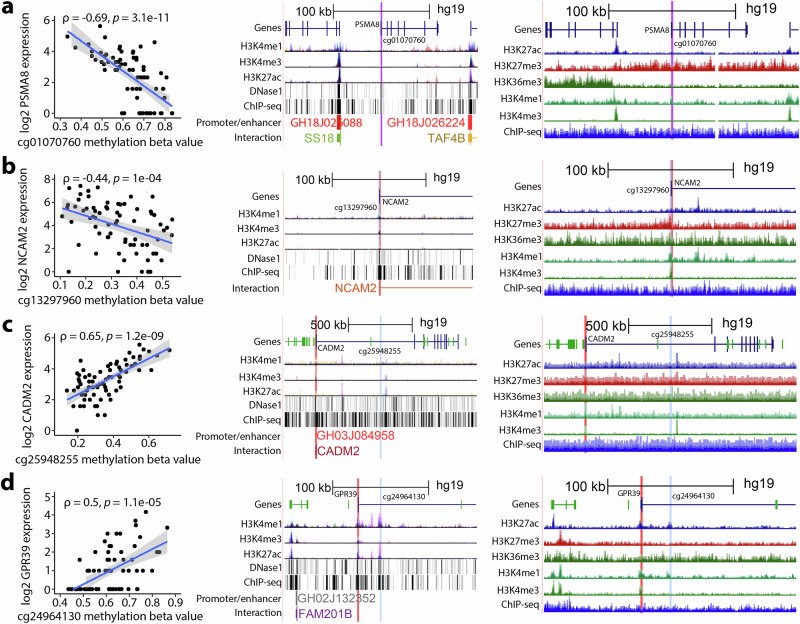
Sex differences in physiological and disease traits are pervasive and begin during early development, but the genetic architecture of these differences is largely unknown. Here, we leverage the human placenta, a transient organ during pregnancy critical to fetal development, to investigate the impact of sex in the regulatory landscape of placental autosomal methylome and transcriptome, and its relevance to health and disease. We find that placental methylation and its genetic regulation are extensively impacted by fetal sex, whereas sex differences in placental gene expression and its genetic regulation are limited. We identify molecular processes and regulatory targets that are enriched in a sex-specific manner, and find enrichment of imprinted genes in sex-differentiated placental methylation, including female-biased methylation within the well-known KCNQ1OT1/CDKN1C imprinting cluster of genes expressed in a parent-of-origin dependent manner. We establish that several sex-differentiated genetic effects on placental methylation and gene expression colocalize with birthweight and adult disease genetic associations, facilitating mechanistic insights on early life origins of health and disease outcomes shaped by sex.


Conflict of interest statement

Competing interests: The authors declare that they have no competing interests. Clinical trial registration: ClinicalTrials.gov, NCT00912132.

Figures

Fig. 1
Fig. 1. Study flowchart.
The workflow summarizes the procedures in identifying sex-biased methylation, gene expression, and genetic regulation in the placenta; functional characterization through assessment of co-occurrence among identified loci and functional annotation using various databases; and illustration of the relevance of the identified loci in disease and health traits in neonates and adults. sex-DM: sex-differentially methylated cytosine-phosphate-guanine sites (CpGs); sex-DE: sex-differentially expressed genes; sex-mQTL: sex-biased methylation quantitative trait locus; sex-eQTL: sex-biased expression quantitative trait locus; GWAS: a genome-wide association study. Genotype (DNA), and RNA-seq (RNA) figures were generated by NIAID Visual & Medical Arts. (10/7/2024) and methylation was adopted. DNA. NIAID NIH BIOART Source. bioart.niaid.nih.gov/bioart/123. NIAID Visual & Medical Arts. (10/7/2024). RNA. NIAID NIH BIOART Source. bioart.niaid.nih.gov/bioart/452.
Fig. 2
Fig. 2. Genome-wide placental sex-biased association results.
Each panel includes a Manhattan plot of -log10 P-values and the corresponding quantile-quantile plot of observed vs expected -log10 P-values and genomic control factor (λ). a sex-differences in methylation at cytosine-phosphate-guanine sites (sex-DM). b sex-biased genetic association with methylation (cis methylation quantitative trait loci (sex-mQTL). c sex-differences in gene expression (sex-DE). d sex-biased genetic association with gene expression (cis expression quantitative trait loci (sex-eQTL). Two-sided t tests were performed for (a) using limma with n = 301, df = 299, and Benjamini-Hochberg adjustment and BACON correction applied for multiple testing corrections. Two-sided t tests were performed for (b) using MatrixEQTL with n = 291, df = 289, and Benjamini-Hochberg adjustment applied for multiple testing corrections. Two-sided likelihood ratio tests were performed for (c) using edgeR with n = 80, df = 1, and Benjamini-Hochberg adjustment applied for multiple testing corrections. Two-sided t tests were performed for (d) using MatrixEQTL with n = 71, df = 69, and Benjamini-Hochberg adjustment applied for multiple testing corrections. Red dots indicate statistically significant results.
Fig. 3
Fig. 3. Top four male-hypermethylated DNA methylation sites significantly correlated with nearby gene expression in placenta and overlap with regulatory regions.
Top associations were selected based on the strength of positive and negative correlations, two from each. The displayed figures include male-hypermethylated CpGs that showed the top two strongest negative correlations (a, b) and the top two strongest positive correlations (c, d) with their corresponding nearby genes and UCSC Genome Browser plots of regulatory sites. For each CpG, the left plot shows a correlation with gene expression in the placenta (two-sided Spearman correlation (ρ) with FDR-adjusted P < 0.05 based on S statistic was considered significant; n = 71); the middle plot shows UCSC Genome Browser’s regulatory sites from ENCODE; the right plot shows UCSC Genome Browser’s regulatory sites in placenta smooth chorion. Red highlights indicate the gene TSS; blue highlights indicate the CpG; and purple highlights indicate that the gene TSS and CpG are in close proximity to each other. Tracks include histone 3 lysine 4 monomethylation (H3K4me1: an enhancer mark), histone 3 lysine 4 trimethylation (H3K4me3: marks transcription start site), histone 3 lysine 27 trimethylation (H3K27me3: marks transcription repression), histone 3 lysine 36 trimethylation (H3K36me3: marks active transcription), and histone 3 lysine 27 acetylation (H3K27ac: marks active transcription) found in 7 cell lines from ENCODE and/or in placenta smooth chorion. Tracks labeled “DNase1” represent DNaseI hypersensitivity clusters in 125 cell types from ENCODE. Tracks labeled “ChIP-seq” represent ChIP-seq clusters in 338 factors and 130 cell types from ENCODE and ChIP-seq marks found in placenta smooth chorion. Tracks labeled “Promoter/enhancer” and “Interaction” represent GeneHancer Double Elite Regulatory Elements and GeneHancer Double Elite Clustered Interactions, respectively. Gray shade denotes a 95% confidence interval. Source data for Fig. 3a–d are provided as a Source Data file.
Fig. 4
Fig. 4. Top four female-hypermethylated DNA methylation sites significantly correlated with nearby gene expression in placenta and overlap with regulatory regions.
Top associations were selected based on the strength of positive and negative correlations, two from each. The displayed figures include female-hypermethylated CpGs that showed the top two strongest negative correlations (a, b) and the top two strongest positive correlations (c, d) with their corresponding nearby genes and UCSC Genome Browser plots of regulatory sites. For each CpG, the left plot shows a correlation with gene expression in the placenta (two-sided Spearman correlation (ρ) with FDR-adjusted P < 0.05 based on S statistic was considered significant; n = 71); the middle plot shows UCSC Genome Browser’s regulatory sites from ENCODE; the right plot shows UCSC Genome Browser’s regulatory sites in placenta smooth chorion. Red highlights indicate the gene TSS; blue highlights indicate the CpG; and purple highlights indicate that the gene TSS and CpG are in close proximity to each other. Tracks included histone 3 lysine 4 monomethylation (H3K4me1: an enhancer mark), histone 3 lysine 4 trimethylation (H3K4me3: marks transcription start site), histone 3 lysine 27 trimethylation (H3K27me3: marks transcription repression), histone 3 lysine 36 trimethylation (H3K36me3: marks active transcription), and histone 3 lysine 27 acetylation (H3K27ac: marks active transcription) found in 7 cell lines from ENCODE and/or in placenta smooth chorion. Tracks labeled “DNase1” represent DNaseI hypersensitivity clusters in 125 cell types from ENCODE. Tracks labeled “ChIP-seq” represent ChIP-seq clusters in 338 factors and 130 cell types from ENCODE and ChIP-seq marks found in placenta smooth chorion. Tracks labeled “Promoter/enhancer” and “Interaction” represent GeneHancer Double Elite Regulatory Elements and GeneHancer Double Elite Clustered Interactions, respectively. Gray shade denotes a 95% confidence interval. Source data for Fig. 4a–d are provided as a Source Data file.
Fig. 5
Fig. 5. Sex-biased methylation quantitative trait associations in placenta.
a Pie chart displaying the distribution of sex-biased methylation quantitative trait associations based on allelic effect magnitude and direction in males and females (Blue = concordant effect direction, n = 134; Green = opposite effect direction, n = 141; Orange = single sex effect, n = 1426; Gray = Unclassified, n = 138). “Unclassified” includes associations that do not fall into the other categories (i.e., sex-biased mQTL associations with two-sided t test FDR-adjusted P ≥ 0.05 (n = 291, df = 289) in both sex strata and/or those with two-sided t test with unequal variance FDR-adjusted Pdiff ≥ 0.05 (n = 291, df = 289). b Regional plot of top male-specific sex-mQTL (rs12242275-cg09082518). The plot to the right indicates the absence of effect in females. c Regional plot of top female-specific sex-mQTL (rs4351362-cp14735364). The plot to the right indicates the absence of effect in males. Data span 200 kb centered at the mQTL SNP. The horizontal axis denotes the genomic position in build hg19, and the vertical axis denotes the association -log10 P-value and recombination rate (cM/Mb). The purple circle point represents the mQTL SNP. The purple triangle point represents the mQTL CpG. The color of each data point indicates its linkage disequilibrium value (r2) with the index SNP based on HapMap2. LocusZoom (http://locuszoom.org/) was used to generate the plot. Source data for Fig. 5b, c are provided as a Source Data file.
Fig. 6
Fig. 6. Sex-biased expression quantitative trait associations in placenta.
a Pie chart displaying the distribution of sex-biased expression quantitative trait associations based on allelic effect magnitude and direction in males and females (Orange = single sex effect, n = 12; Gray = Unclassified, n = 1). “Unclassified” includes associations that do not fall into the other categories (i.e., sex-biased eQTL associations with two-sided t-test FDR-adjusted P ≥ 0.05 (n = 71, df = 69) in both sex strata and/or those with two-sided t-test with unequal variance FDR-adjusted Pdiff ≥ 0.05 (n = 71, df = 69). b Regional plot of top male-specific sex-eQTL (rs11986287-SLC52A2). The plot to the right indicates the absence of effect in females. c Regional plot of top female-specific sex-eQTL (rs79910893-LPCAT3). The plot to the right indicates the absence of effect in males. Data span 200 kb north of the gene TSS position to 200 kb south of the eQTL SNP. The horizontal axis denotes the genomic position in build hg19, and the vertical axis denotes the association -log10 P-value and recombination rate (cM/Mb). The purple circle point represents the eQTL SNP. The color of each data point indicates its linkage disequilibrium value (r2) with the index SNP based on HapMap2. A gene symbol and associated track from the UCSC Genome Browser shows the eQTL target gene’s physical location. LocusZoom (http://locuszoom.org/) was used to generate the plot. Source data for Fig. 6b, c are provided as a Source Data file.
Fig. 7
Fig. 7. Correlation between males and females of placental methylation and gene expression levels of CpG and gene targets of sex-biased genetic regulation.
a DNA methylation level of sex-mQTL target CpGs (n = 521 CpGs). b Gene expression levels of sex-eQTL target genes (n = 9 gene transcripts). A two-sided Spearman correlation (ρ) test was implemented and was considered significant if P < 0.05. The p-value in a is approximately equal to zero. The error band in gray denotes a 95% confidence interval. Source data for Fig. 7a, b are provided as a Source Data file.
Fig. 8
Fig. 8. Upset plot of male- and female-hypermethylated DNA methylation sites showing overlapping correlation with neonatal anthropometry and placental size measures.
The figures display the number of male-hypermethylated (a) and female-hypermethylated (b) CpG sites that are positively correlated with neonatal and placental measures, and the number of male-hypermethylated (c) and female-hypermethylated (d) CpG sites that are negatively correlated with neonatal and placental measures. The measures are head circumference (HC), birth length (BL), birth weight (BW), placental weight (PW), and placental-birth weight ratio (PW/BW). Vertical lines connecting black-shaded circles denote measures that exhibited a shared correlation with the number of CpGs in bars.
Fig. 9
Fig. 9. Circos plots of significantly enriched canonical pathways for genes near sex-differentially methylated sites.
The outer track represents the enriched canonical pathways obtained using the FUMA tool, ordered from the most to the least significant in the clockwise direction. The middle track represents the hypergeometric test for enrichment FDR-adjusted P-value. The orange bars in the inner-most track represent the number of genes near the sex-differentially methylated sites that overlapped with genes in the database of each pathway. The green lines connect enriched pathways shared between males and females, with width proportional to the number of shared genes. Database abbreviations: B: BIOCARTA, K: KEGG, N: NABA, P: PID, R: REACTOME, S: SIG. Source data are provided as a Source Data file.

Similar articles

Cited by

References

    1. Khramtsova, E. A., Davis, L. K. & Stranger, B. E. The role of sex in the genomics of human complex traits. Nat. Rev. Genet20, 173–190 (2019). - PubMed
    1. Clifton, V. L. Review: Sex and the human placenta: mediating differential strategies of fetal growth and survival. Placenta31, S33–S39 (2010). - PubMed
    1. Eriksson, J. G., Kajantie, E., Osmond, C., Thornburg, K. & Barker, D. J. Boys live dangerously in the womb. Am. J. Hum. Biol.22, 330–335 (2010). - PMC - PubMed
    1. Broere-Brown, Z. A. et al. Fetal sex and maternal pregnancy outcomes: a systematic review and meta-analysis. Biol. Sex. Differ.11, 26 (2020). - PMC - PubMed
    1. Sandovici, I., Fernandez-Twinn, D. S., Hufnagel, A., Constância, M. & Ozanne, S. E. Sex differences in the intergenerational inheritance of metabolic traits. Nat. Metab.4, 507–523 (2022). - PubMed

LinkOut - more resources