. 2025 May 1;16(1):4094.
doi: 10.1038/s41467-025-59252-w.

Altered extracellular matrix structure and elevated stiffness in a brain organoid model for disease

Affiliations

Altered extracellular matrix structure and elevated stiffness in a brain organoid model for disease

Maayan Karlinski Zur et al. Nat Commun. .

Abstract

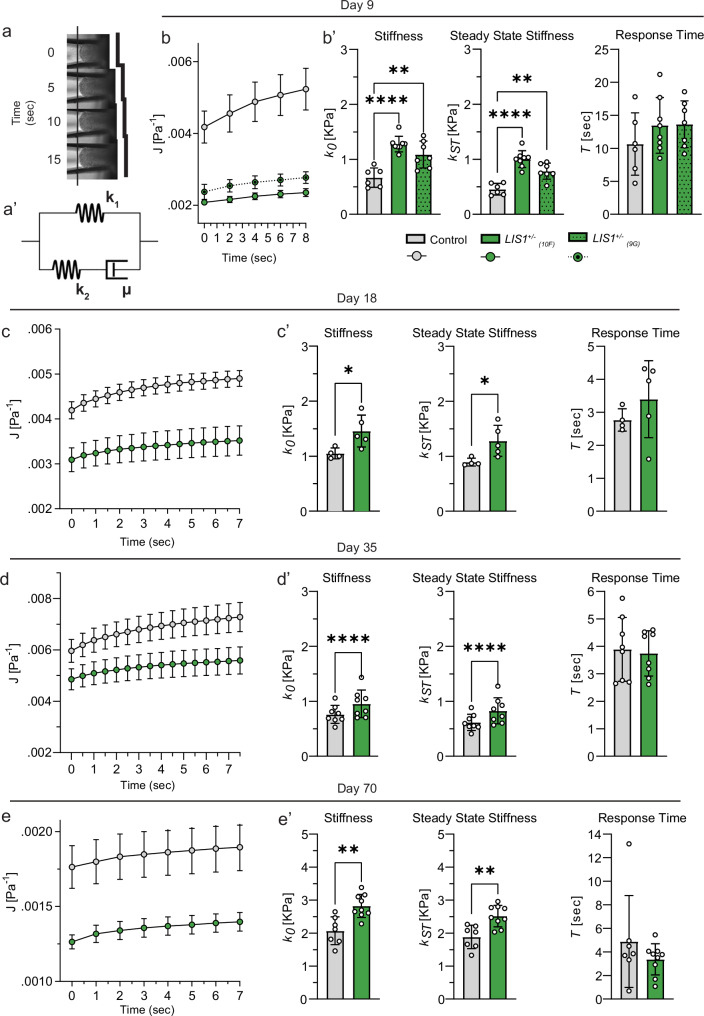
The viscoelastic properties of tissues influence their morphology and cellular behavior, yet little is known about changes in these properties during brain malformations. Lissencephaly, a severe cortical malformation caused by LIS1 mutations, results in a smooth cortex. Here, we show that human-derived brain organoids with LIS1 mutation exhibit increased stiffness compared to controls at multiple developmental stages. This stiffening correlates with abnormal extracellular matrix (ECM) expression and organization, as well as elevated water content, measured by diffusion-weighted MRI. Short-term MMP9 treatment reduces both stiffness and water diffusion levels to control values. Additionally, a computational microstructure mechanical model predicts mechanical changes based on ECM organization. These findings suggest that LIS1 plays a critical role in ECM regulation during brain development and that its mutation leads to significant viscoelastic alterations.


Conflict of interest statement

Competing interests: The authors declare no competing interests.

Figures

Fig. 1
Fig. 1. LIS1 mutation leads to the stiffening of brain organoids, which are solid–like viscoelastic tissues.
a Under constant suction pressure, organoids are continuously aspirated into the pipette and gradually approach a steady-state deformation. The organoids’ creep compliance is well-fitted by the standard linear solid (SLS) viscoelastic model (a’). be Averaged creep compliance measurements (symbols) are fitted by the SLS model (curves) at the specified conditions. Symbols and error bars correspond to the mean and standard error of the mean. b’e’ SLS fits the instantaneous (k0) and steady-state (kst) stiffness, and response time (τ) are plotted. Symbols represent individual organoids recorded, while the bar graphs and error bars correspond to the mean and standard deviation. The analysis included the following number of organoids, each measured separately and fitted independently: b Day-9: ncontrol = 6, n10F = 7, n9G = 7. c Day-18: ncontrol = 4, n10F = 5. d Day-35: ncontrol = 8, n10F = 8, and e Day-70: ncontrol = 7, n10F = 9. Statistical significance is evaluated via one-way ANOVA test in b’ and via two-tailed independent student’s t test in c’e’. * To strengthen our findings, we tested an additional LIS1+/ ESCs line annotated as 9G, generated in the same approach discussed in the methods. However, throughout the manuscript, we consistently used the 10F cell line.
Fig. 2
Fig. 2. Matrisome composition of corticO.
a Metascape analysis on the proteomics data from 35-day-old corticOs. b Heatmap of top DE matrisomal proteins in LIS1+/ and control 105-day-old cortical organoids. Cell color expresses normalized reads following logarithmic transformation and Z-score normalization. c Western blot analysis indicated the elevation of Lamin A/C and the reduction in γH2AX in 105-day-old LIS1+/ corticOs. d Quantification of western blot results (mean ± SD, two-tailed unpaired student’s t test, α = 0.05, * means p value < 0.1 and ** means p value < 0.01). The analysis included: a Day-35, for each genotype N corticOs = 4, ncorticOs = 10–12, b, c Day-105 proteomics and WB: NcorticOs = 4; ncorticOs = 6–8.
Fig. 3
Fig. 3. The effects of LIS1+/ mutation and ECM proteolysis on corticOs mechanics and structural organization.
a Day-18 control and LIS1+/ mutated organoids were treated with 500 nM MMP9 catalytic domain for 10 min at 37 °C before being submitted for MPA creep test measurement and MRI imaging. Created in BioRender. Solomonov, I. (2025) https://BioRender.com/bncn17s. b Similar to the non-treated organoids, the creep compliance of MMP9-treated organoids of both genotypes was fitted to the linear viscoelastic SLS model with a high goodness of fit (R-square (R2 > 0.99)). Symbols and error bars correspond to mean and SEM across, organoids. b’, Mean ± SD of the fitted SLS viscoelastic elements, k0, kst, and τ show greater softening of the mutated corticOs by ECM proteolysis. Statistical significance is evaluated via one-way ANOVA test with the following number of organoids, each measured separately and fitted independently: ncontrol = 4, n10F = 5, ncontrolMMP9 = 5, n10FMMP9 = 4. c A representative DW-MRI of eight LIS1+/ corticOs (left) and the calculated ADC map. One central slice is shown. Three out of six b-values (the degree of diffusion weighting) are shown for a central slice. d Estimated maximal likelihood position of the ADC (apparent diffusion coefficient) distributions of control, LIS1+/, and MMP9-treated LIS1+/ corticOs show the effect of altered genotypes rescued by ECM proteolysis. Error bars correspond to SD across consecutively repeated scans. e The relative deviations of the ADC values of LIS1+/ and MMP9-treated LIS1+/ corticOs from control organoids (n = 5) are plotted. The potential impact of longitudinal drift was eliminated by calculating each scan’s relative deviation, which was then averaged.
Fig. 4
Fig. 4. Rescued genes and inverse interaction between mRNA and miRs in LIS1+/ organoids.
a A heatmap showing the top rescued genes and their expression before and after the MMP9 treatment, N = 4*, n = 12–14. b Top KEGG pathways identified to be most influenced by the inverse relation between miRs and mRNA expression. Negative numbers in the bar plot indicate that mRNA levels were reduced and that their targeting miRs increased. In contrast, positive values on the x-axis indicate an increase in mRNAs in the LIS1+/ samples while their targeting miRs were reduced compared to the control. c Small RNA-seq integrated with target matrisome-related genes showing the opposite expression pattern of miRs and their predicted targeted mRNAs. *Two outlier groups from the non-treated LIS1+/ samples were excluded from the analysis.
Fig. 5
Fig. 5. Collagen organization and a microstructure mechanical model.
ab Immunostainings of COL4A1 and COL3A1 on a day 9 and b day 18, in control and LIS1+/ organoids with respective normalized intensity quantification of staining showing no difference between control and mutant organoids (Two-tailed independent student’s t test, α = 0.05, Day 9: Ncontrol = 3, NLIS1+/− = 3; Day 18–Ncontrol = 5, NLIS1+/− = 5). Scale bars represent 50 µm. cd Sholl analysis of COL4A1 signal in c day 9 (Mann–Whitney U test for the signal data between control and LIS1 groups, p value = 0.0057) and d day 18 (Mann–Whitney U test for the signal data between control and LIS1 groups, p value = 3.28e47) control and LIS1+/ organoids represented as distribution from the center of the organoids highlighting the circular arrangement of collagen deposition in the control compared to an abnormal collagen distribution in the LIS1+/ organoids (Mann–Whitney U test, α = 0.05). The Sholl analysis included: Day 9–Ncontrol = 2, NLIS1+/− = 3; Day 18–Ncontrol = 3, NLIS1+/− = 3. ef Simulation snapshots for 1% and 20% uniaxial compression strain in the control case. The control case is described by ECM removed within a localized circular region in the center of the system, as motivated by the ring of ECM. g, h Simulation snapshots for 1% and 20% uniaxial compression strain in LIS1+/ mutant case. The mutant case is described by a randomly diluted ECM. i Organoid stiffness (in simulation units) as a function of occupation probability p, which indicates the amount of ECM. Here, N = 64, Nc = 32, and R = 10.

References

    1. Chaudhuri, O., Cooper-White, J., Janmey, P. A., Mooney, D. J. & Shenoy, V. B. Effects of extracellular matrix viscoelasticity on cellular behaviour. Nature584, 535–546 (2020). - PMC - PubMed
    1. Franze, K. The mechanical control of nervous system development. Development140, 3069–3077 (2013). - PubMed
    1. Chighizola, M. et al. Mechanotransduction in neuronal cell development and functioning. Biophys. Rev.11, 701–720 (2019). - PMC - PubMed
    1. Wozniak, M. A. & Chen, C. S. Mechanotransduction in development: a growing role for contractility. Nat. Rev. Mol. Cell Biol.10, 34–43 (2009). - PMC - PubMed
    1. Panciera, T., Azzolin, L., Cordenonsi, M. & Piccolo, S. Mechanobiology of YAP and TAZ in physiology and disease. Nat. Rev. Mol. Cell Biol.18, 758–770 (2017). - PMC - PubMed

Substances

LinkOut - more resources