. 2025 May 1;16(1):4079.
doi: 10.1038/s41467-025-59441-7.

Synaptic vesicle-omics in mice captures signatures of aging and synucleinopathy

Affiliations

Synaptic vesicle-omics in mice captures signatures of aging and synucleinopathy

Virginia Gao et al. Nat Commun. .

Abstract

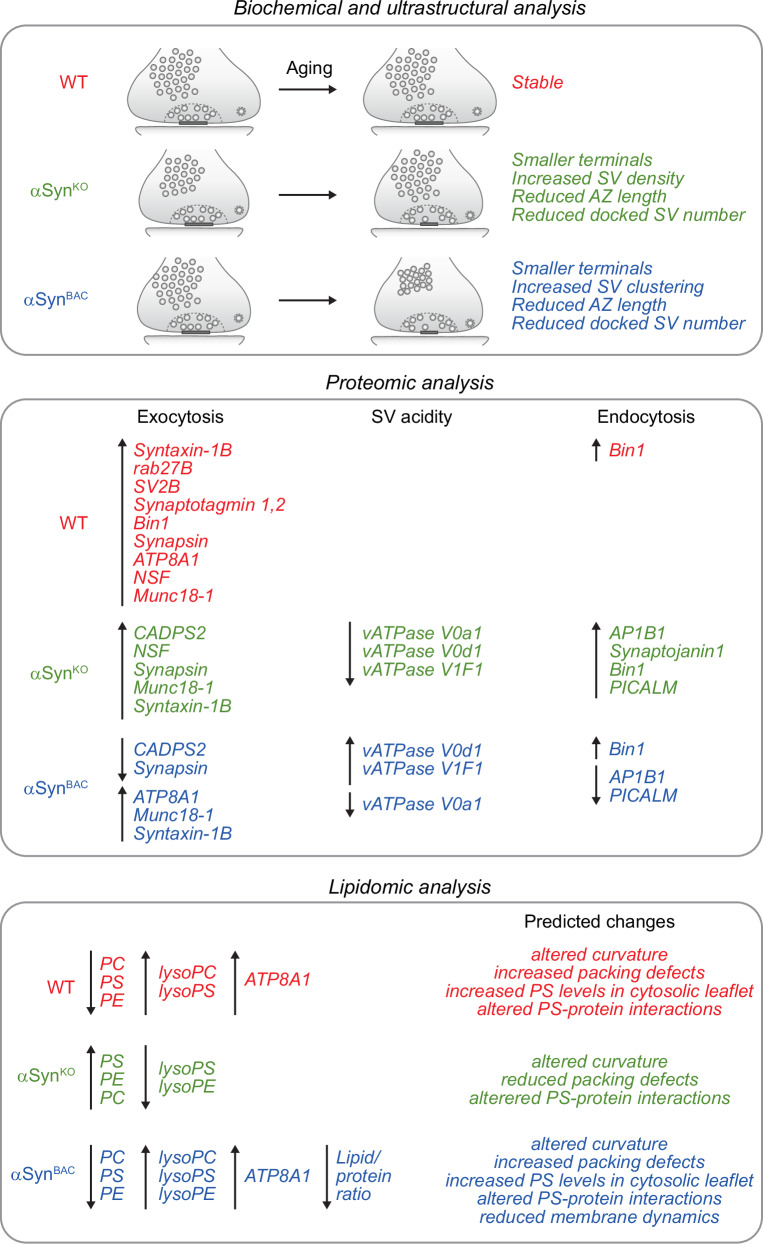
Neurotransmitter release occurs through exocytosis of synaptic vesicles. α-Synuclein's function and dysfunction in Parkinson's disease and other synucleinopathies is thought to be tightly linked to synaptic vesicle binding. Age is the biggest risk factor for synucleinopathy, and ~15% of synaptic vesicle proteins have been linked to central nervous system diseases. Yet, age- and disease-induced changes in synaptic vesicles remain unexplored. Via systematic analysis of synaptic vesicles at the ultrastructural, protein, and lipid levels, we reveal specific changes in synaptic vesicle populations, proteins, and lipids over age in wild-type mice and in α-synuclein knockout mice with and without expression of human α-synuclein. Strikingly, we find several previously undescribed synaptic changes in mice lacking α-synuclein, suggesting that loss of α-synuclein function contributes to synaptic dysfunction. These findings not only provide insights into synaptic vesicle biology and disease mechanisms in synucleinopathy, but also serve as a baseline for further mechanistic exploration of age- and disease-related alterations in synaptic vesicles.


Conflict of interest statement

Competing interests: The authors declare no competing interests.

Figures

Fig. 1
Fig. 1. Analysis of wildtype mice and mouse models of synucleinopathy.
af Analysis of motor behavior of WT mice and synucleinopathy mouse models. WT, αSynA53T, αSynKO and αSynBAC mice were analyzed at 1 month, 3 months, and 10 months of age for foot slips on a beam (a, d), hang time on an inverted grid (b, e), and success of trials to climb down a vertical pole (c, f). Data are means ± SEM and were analyzed by 2-way ANOVA and Tukey’s multiple comparisons test (* p < 0.05, *** p < 0.001, **** p < 0.0001 comparing the 3 month and 10 month group to the 1 month group within a given genotype; # p < 0.05, ## p < 0.01, #### p < 0.0001 comparing the same age groups of αSynKO and αSynBAC mice to WT mice; ° p < 0.05, °° p < 0.01, °°° p < 0.001, °°°° p < 0.0001 comparing the same age groups of αSynKO and αSynBAC mice; n = 15 WT and 9 αSynA53T mice at all ages (a); n = 15 WT mice at all ages, 8 αSynA53T mice at 1 month and 9 αSynA53T mice at 3 and 10 months (b); n = 15 WT and 7 αSynA53T mice at all ages (c); n = 22 1-month, 16 3-month, and 9 10-month WT mice, 21 1-month, 17 3-month, and 20 10-month αSynKO mice, and 16 1-month, 14 3-month, and 27 10-month αSynBAC mice (d); n = 22 1-month, 16 3-month, and 9 10-month WT mice, 12 1-month, 14 3-month, and 15 10-month αSynKO mice, and 10 1-month, 18 3-month, and 30 10-month αSynBAC mice (e); n = 22 1-month, 16 3-month, and 9 10-month WT mice, 12 1-month, 14 3-month, and 15 10-month αSynKO mice, and 9 1-month, 14 3-month, and 30 10-month αSynBAC mice (f)). gi Analysis of levels of total αSyn and αSynpS129 at indicated ages in 20 µg of brain homogenates from αSynA53T and littermate WT mice (g), αSynL61 and littermate WT mice (h), and αSynKO, αSynBAC and WT mice (i), normalized to beta-III-tubulin (Tuj1) (g, h) or GAPDH (i). Data are means ± SEM (* p < 0.05, ** p < 0.01 by unpaired t-test with Welch’s correction in panel g and by unpaired t test in panel h, and # p < 0.05 by one sample two-sided Wilcoxon signed-rank test (for comparisons to the WT 1 month group) or 2-way ANOVA and Tukey’s multiple comparisons test (for all remaining comparisons) in panel i, comparing the same age groups of WT and αSynBAC mice; n = 3 (g, h) or n = 6 WT mice at all ages, 6 1-month and 3-month αSynBAC, and 8 10-month αSynBAC mice (i)). See also Supplementary Fig. S1. Source data are provided as a Source Data file.
Fig. 2
Fig. 2. Ultrastructural changes in synaptic terminals from αSynKO and αSynBAC mice.
a, b Representative electron micrographs from the substantia nigra (a) or the striatum (b) in WT mice, αSynKO mice, and αSynBAC mice at 1 month, 3 months, and 10 months of age. c Cartoon to highlight how synapse analysis was performed (SV = synaptic vesicle; AZ = active zone; CCV = clathrin-coated vesicle; see also Methods section). di Analysis of terminal area (d), SV number (e), SV density (f), number of docked SVs (g), active zone length (h), and SV cluster density (i) in the substantia nigra (left panels) and the striatum (right panels). Data are means ± SEM and were analyzed by 2-way ANOVA and Tukey’s multiple comparisons test (*p < 0.05, **p < 0.01 comparing the 3 month and 10 month group to the 1 month group within a given genotype; # p < 0.05, ##p < 0.01 comparing the same age groups of αSynKO and αSynBAC mice to WT mice; °p < 0.05, °°p < 0.01 comparing the same age groups of αSynKO and αSynBAC mice; n = 3 WT and αSynKO mice at all ages, 3 αSynBAC mice at 1 and 10 months of age, and 5 αSynBAC mice at 3 months of age). j Summary of identified changes. See also Supplementary Fig. S2. Source data are provided as a Source Data file.
Fig. 3
Fig. 3. Biochemical analysis of synaptic vesicle pools reveals an increase in free synaptic vesicles in αSynKO mice.
a Subcellular fractionation of mouse brain homogenates into SV pools. Brain homogenates were first subjected to Percoll gradient centrifugation to isolate synaptosomes. Synaptosomes were then osmotically lysed, synaptosomal membranes were pelleted ( = crude SV fraction) and further separated into free SVs (fractions 5-11) and docked/active zone SVs or SV clusters (fractions 27-33) using sucrose gradient centrifugation. Note that SV clusters migrate to the lower fractions due to their higher density compared to the free SVs. bj Analysis of the sucrose gradient fractions by quantitative immunoblotting. Every second fraction of the sucrose gradient was analyzed by quantitative immunoblotting of equal volumes per fraction for the integral SV proteins SV2 (b) and synaptophysin 1 (e), and the plasma membrane protein SNAP-25 (h). Each fraction was plotted as percent of total protein (c, f, i), and % of free SVs versus docked/active zone SVs or clustered SVs was extracted from these data (d, g, j). Data are means ± SEM and were analyzed by 2-way ANOVA and Tukey’s multiple comparisons test (*p < 0.05, **p < 0.01, ***p < 0.001 comparing the 3 month and 10 month group to the 1 month group within a given genotype; #p < 0.05, ##p < 0.01, ###p < 0.001 comparing the same age groups of αSynKO and αSynBAC mice to WT mice; °p < 0.05, °°p < 0.01, °°°p < 0.001, °°°°p < 0.0001 comparing the same age groups of αSynKO and αSynBAC mice; n = 6 WT and αSynKO mice at all ages, 6 αSynBAC mice at 1 and 3 months of age, and 9 αSynBAC mice at 10 months of age). Source data are provided as a Source Data file.
Fig. 4
Fig. 4. Lack of αSyn or expression of human αSyn does not affect overall synaptic protein levels in synaptosomes.
ae Synaptosomes (20 µg each) isolated from WT, αSynKO and αSynBAC mice at 1 month, 3 months and 10 months of age were analyzed by quantitative immunoblotting to the indicated proteins (Syp1 = synaptophysin 1; Syt1 = synaptotagmin-1; αSyn = α-synuclein; βSyn = β-synuclein; γSyn = γ-synuclein). Data are means ± SEM and were analyzed by one sample two-sided Wilcoxon signed-rank test (for comparisons to the WT 1 month group) or 2-way ANOVA and Tukey’s multiple comparison test (for all remaining comparisons) (*p < 0.05 comparing the 3 month and 10 month group to the 1 month group within a given genotype; #p < 0.05 comparing the same age groups of αSynKO and αSynBAC mice to WT mice; n = 6 WT and αSynKO mice at all ages, 6 αSynBAC mice at 1 and 3 months of age, and 9 αSynBAC mice at 10 months of age). See also Supplementary Figs. S3 and S44. Source data are provided as a Source Data file.
Fig. 5
Fig. 5. Quantitative proteomic analysis of crude synaptic vesicles reveals specific changes associated with age and αSyn genotype.
ac Volcano plots for analysis of changes in SV proteins, active zone proteins, and proteins involved in clathrin coat-mediated endocytosis identified through quantitative mass spectrometry. Data shown are means and were normalized to the 1-month group for WT (a), αSynKO (b), and αSynBAC mice (c) (p < 0.05 was marked as statistically significant, i.e. data points above the dotted line; data were analyzed by 2-way ANOVA, followed by Tukey’s multiple comparison test to obtain adjusted p values; n = 3 samples obtained by combining 2 mice each per genotype and age into 1 sample). df Summary of the quantitative proteomic analysis. Shown are changes in protein levels associated with aging (d), changes specific to the genotype, with indication of magnitude of the change and their physiological role (e), and a cartoon indicating age-specific (purple) and genotype-specific (orange) changes (f). See also Supplementary Figs. S4–S9 and S45. Source data are provided as a Source Data file.
Fig. 6
Fig. 6. Quantitative lipidomic analysis of pure synaptic vesicles identifies altered phospholipid levels and metabolism.
a Pie chart of the lipid composition of SVs in negative (left) and positive mode (right) of analysis (PE, phosphatidylethanolamine; PS, phosphatidylserine; PC, phosphatidylcholine; PI, phosphatidylinositol; PG, phosphatidylglycerol; PA, phosphatidic acid; LPC, lyso PC; LPE, lyso PE; LPS, lyso PS; Hex1Cer, hexosyl ceramide; SM, sphingomyelin). b Analysis of total lipid levels in positive and negative mode. Data are means ± SEM and were analyzed by 2-way ANOVA and Tukey’s multiple comparisons test (* p < 0.05, ** p < 0.01 comparing the 3 month and 10 month group to the 1 month group within a given genotype; # p < 0.05 comparing the same age groups of αSynKO and αSynBAC mice to WT mice; °°° p < 0.001 comparing the same age groups of αSynKO and αSynBAC mice; n = 6 mice per genotype and age). c SV lipid metabolic map. di Pathway analysis of lipidomic changes, plotted as age-dependent changes of WT (d), αSynKO (e), and αSynBAC (f), or as changes at 10-months of age between αSynBAC and WT (g), αSynKO and WT (h), and αSynBAC and αSynKO (i). j Effects of identified changes on SV membrane curvature, fluidity and protein interactions. See also Supplementary Figs. S10–S41. Source data are provided as a Source Data file.
Fig. 7
Fig. 7. Synaptic vesicles change with age and disease.
Summary of the changes identified by ultrastructural, biochemical, proteomic, and lipidomic analysis of SVs isolated from WT, αSynKO and αSynBAC mice over 10 months of age. The combination of these changes is proposed to lead to synaptic dysfunction in synucleinopathy.

Similar articles

Cited by

References

    1. Sudhof, T. C. The synaptic vesicle cycle. Annu Rev. Neurosci.27, 509–547 (2004). - PubMed
    1. Fan, W. J. et al. Synaptic aging disrupts synaptic morphology and function in cerebellar purkinje cells. Neural Regen. Res13, 1019–1025 (2018). - PMC - PubMed
    1. Soukup, S. F., Vanhauwaert, R. & Verstreken, P. Parkinson’s disease: convergence on synaptic homeostasis. EMBO J37, e98960 (2018). - PMC - PubMed
    1. Gcwensa, N. Z., Russell, D. L., Cowell, R. M. & Volpicelli-Daley, L. A. Molecular mechanisms underlying synaptic and axon degeneration in parkinson’s disease. Front Cell Neurosci.15, 626128 (2021). - PMC - PubMed
    1. Taoufiq, Z. et al. Hidden proteome of synaptic vesicles in the mammalian brain. Proc. Natl Acad. Sci. USA117, 33586–33596 (2020). - PMC - PubMed

Substances

Grants and funding

LinkOut - more resources