. 2025 Jun;26(11):2945-2966.
doi: 10.1038/s44319-025-00458-w. Epub 2025 May 1.

Molecular basis for assembly and activation of the Hook3 - KIF1C complex-dependent transport machinery

Affiliations

Molecular basis for assembly and activation of the Hook3 - KIF1C complex-dependent transport machinery

Hye Seon Lee et al. EMBO Rep. 2025 Jun.

Abstract

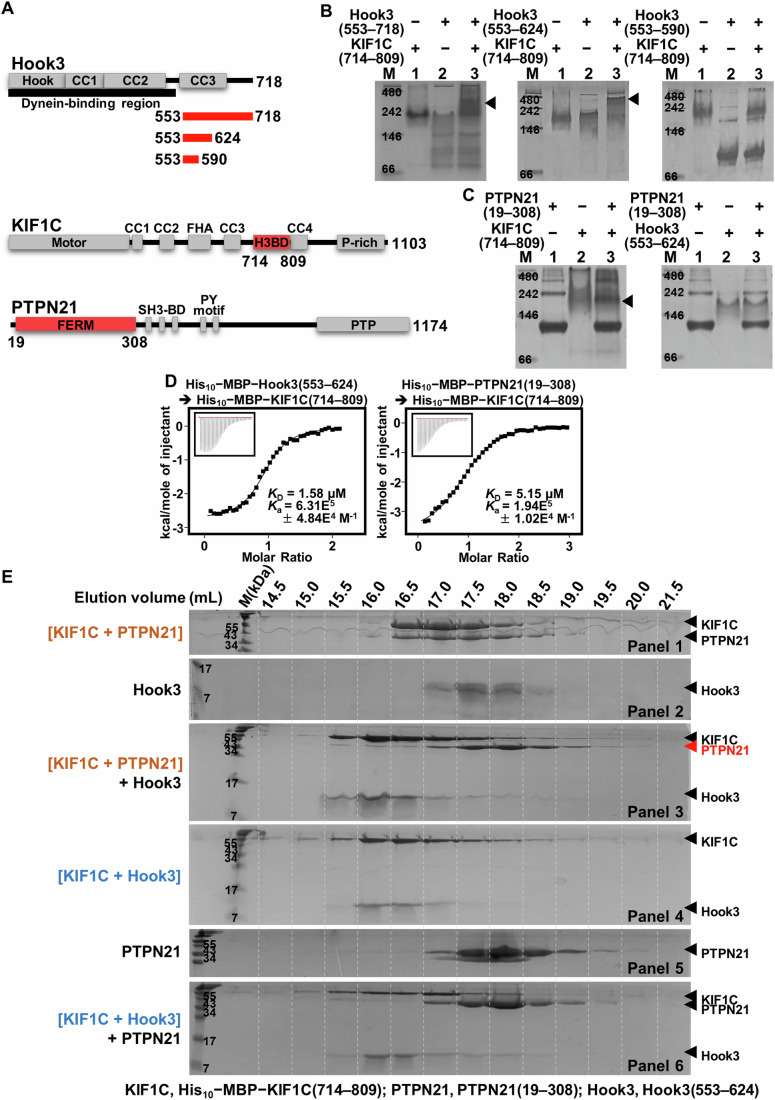
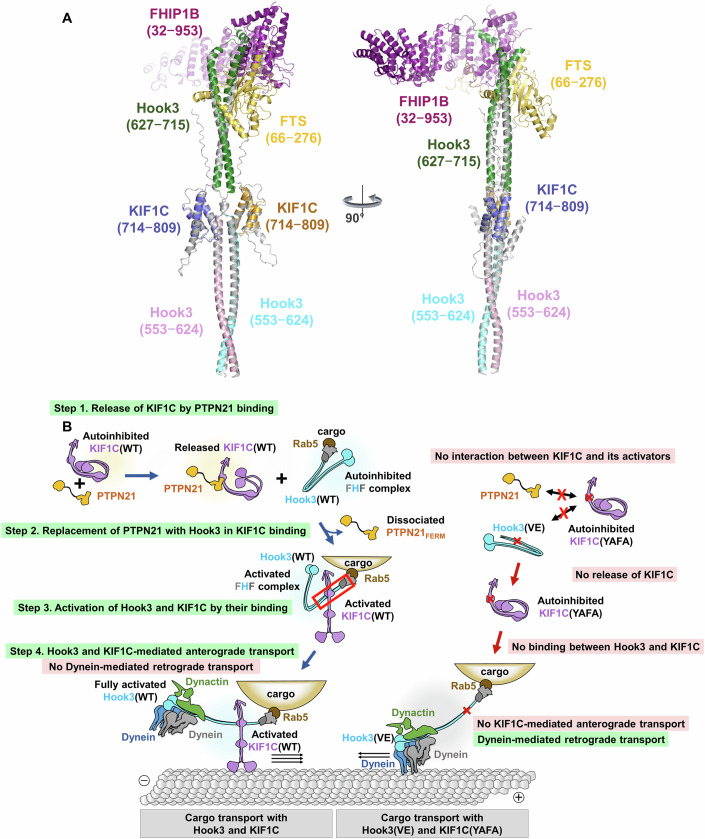
Microtubule-associated cargo transport, a central process governing the localization and movement of various cellular cargoes, is orchestrated by the coordination of two types of motor proteins (kinesins and dyneins), along with diverse adaptor and accessory proteins. Hook microtubule tethering protein 3 (Hook3) is a cargo adaptor that serves as a scaffold for recruiting kinesin family member 1C (KIF1C) and dynein, thereby regulating bidirectional cargo transport. Herein, we conduct structural and functional analyses of how Hook3 mediates KIF1C-dependent anterograde cargo transport through interaction with KIF1C and PTPN21. We verify the interactions among the three proteins and determine the crystal structure of the Hook3(553-624) - KIF1C(714-809) complex. Subsequent structure-based mutational analysis demonstrates that this complex formation is necessary and sufficient for the interaction between the full-length proteins in HEK293T cells and plays a key role in Hook3- and KIF1C-mediated anterograde transport in RPE1 cells. Thus, this study provides a basis for a comprehensive understanding of how Hook3 cooperates with other components during the initial steps of activation and assembly of the Hook3- and KIF1C-dependent cargo transport machinery.

Keywords: Hook3; KIF1C; PTPN21; Structure; Transport.


Conflict of interest statement

Disclosure and competing interests statement. The authors declare no competing interests.

Figures

Figure 1
Figure 1. Biochemical verification of interaction among Hook3, KIF1C, and PTPN21.
(A) Scheme of the PTPN21, KIF1C, and Hook3 domains. The constructs used for the subsequent biochemical analyses were marked in red. (B, C) Native gel electrophoresis. Recombinant proteins were subjected to native-polyacrylamide gel electrophoresis alone or after mixing and 16 h incubation, and then visualized by Coomassie staining. (B) His10 − MBP − KIF1C(714–809) and His10 − MBP−Hook3(553–718/553–624/553–590); (C) His10 − MBP − PTPN21(19–308) and His10 − MBP − KIF1C(714–809) or His10 − MBP−Hook3(553–624). Arrowheads indicate new bands with high molecular weights appearing in lane 3 of the left and middle panels of (B) and the left panel of (C). M size marker. (D) Binding affinity measurements. ITC was conducted by titrating 0.8 mM His10 − MBP−Hook3(553–624) (left) or His10 − MBP − PTPN21(19–308) (right) into 0.04 mM His10 − MBP − KIF1C(714–809). Curve fittings of the integrated heat per mole of added ligand were used to deduce the KD values. KD dissociation constant, Ka association constant. (E) Protein replacement analysis. Recombinant Hook3, KIF1C, and PTPN21 proteins were prepared, mixed as indicated, and then subjected to size-exclusion chromatography in a SuperdexTM 200 Increase 10/300 GL column. The fractions eluted from 14.5 to 21.5 mL were analyzed by sodium dodecyl sulfate-polyacrylamide gel electrophoresis and visualized by Coomassie staining. M size marker. Source data are available online for this figure.
Figure 2
Figure 2. Structural analysis of the Hook3 − KIF1C complex.
(A) Schematic diagram showing the domains of Hook3 and KIF1C. The two truncated constructs used for the crystallization were marked in red. (B) Overall structure of Hook3(553–624; pink and mint) bound to KIF1C(714–809; navy and beige) shown as ribbon representation. N′ and C′ indicate the amino- and carboxyl-terminus of each polypeptide, respectively. Dashed lines linking α2 and α3 of KIF1C represent invisible regions in the crystal structure owing to poor electron density. (C) Detailed view of the intermolecular interaction between KIF1C (navy) and two Hook3 proteins (pink and mint). Residues involved in the complex formation are represented as sticks with labels. The three amino acids selected for preparation of binding-disrupting mutant proteins (Tyr757 and Phe764 of KIF1C; Val614 of Hook3) are shown in red.
Figure 3
Figure 3. Biochemical analysis of intermolecular binding among Hook3, KIF1C, and PTPN21.
(A, B) Native gel electrophoresis. (A) Recombinant His10 − MBP − KIF1C(714–809; WT or Y757A ∙ F764A) and His10 − MBP−Hook3(553–624; WT or V614E) were subjected to native gel electrophoresis individually (lanes 1–4) or after mixing and 16 h incubation (lanes 5–8) and then visualized by Coomassie staining. (B) Recombinant His10 − MBP − KIF1C(714–809; WT or Y757A ∙ F764A) and His10 − MBP − PTPN21(19–308; WT) were subjected to native gel electrophoresis individually (lanes 1, 2, and 4) or after mixing and 16 h incubation (lanes 3 and 5) and then visualized by Coomassie staining. The arrowhead indicates the new band with a higher molecular weight in lane 3. M size marker, WT wild-type, YAFA Y757A ∙ F764A, VE V614E. (C) Co-immunoprecipitation analysis. Intermolecular binding between full-length KIF1C(WT or Y757A ∙ F764A)−Flag−EGFP and Hook3(WT or V614E)−Myc−FuRed transiently expressed in HEK293T cells was analyzed by immunoprecipitation and immunoblotting as indicated. Glyceraldehyde 3-phosphate dehydrogenase (GAPDH) was used as a protein loading control. Asterisks indicate heavy or light immunoglobulin chains. WT wild-type, YAFA Y757A ∙ F764A, VE V614E, IP immunoprecipitation, IB immunoblotting. Source data are available online for this figure.
Figure 4
Figure 4. Tail enrichment of Hook3 and KIF1C in RPE1 cells.
(A) Representative images of RPE1 cells co-expressing wild-type or mutant KIF1CFlagEGFP and Hook3MycFuRed at 16 h post transfection. Scale bars, 10 μm. (B, C) Tail enrichment of KIF1CFlag−EGFP (B) and Hook3Myc−FuRed (C) upon co-expression in RPE1 cells. Tail/cytoplasm ratio of each protein is presented as histogram (top) and in tabular forms (bottom). Values are means ± standard error of the mean. ns not significant; *P < 0.05; ***P < 0.005 by the Student’s two-tailed t test. WT wild-type, YAFA Y757A ∙ F764A, VE V614E. Source data are available online for this figure.
Figure 5
Figure 5. Interaction with KIF1C facilitates Hook3-mediated anterograde cargo transport in RPE1 cells.
(A) Schematic representation of the chemically inducible cargo delivery analysis. Rapamycin treatment leads to recruitment of FKBP − EGFP−MoA-tagged mitochondria to FuRed−FRB-tagged Hook3 on microtubules. (B) Live-cell images of RPE1 cells co-expressing FKBP − EGFP−MoA, KIF1CmTagBFP2, and Hook3−FuRed−FRB in the wild-type or mutant forms. Numbers with an apostrophe represent the time lapses (in min) after 500 nM rapamycin treatment. Colored rectangles represent the cell tips analyzed in (C). Scale bars, 10 μm. WT wild-type, YAFA Y757A ∙ F764A, VE V614E. (C) Magnified images of boxes marked in (B) with intensity profiles along the indicated lines. Each intensity on one-line profile was normalized to that of the maximum value of the profile. (D) Tail enrichment of FKBP − EGFP−MoA-tagged mitochondria before (−2 min) and after (10 min) 500 nM rapamycin treatment. Tail/cytoplasm ratio of tagged mitochondria under each co-expression condition was analyzed, and is presented as dot plots. Values are means ± standard error of the mean. ns, not significant; ***P < 0.0001 by one-way ANOVA. WT wild-type, YAFA Y757A ∙ F764A, VE V614E. (E) Time-course intensity profiles of the tail/cytoplasm ratio of FKBP − EGFP−MoA-tagged mitochondria after 500 nM rapamycin treatment. Each intensity on one-line profile was normalized to that of the maximum value of the profile. WT wild-type, YAFA Y757A ∙ F764A, VE V614E. Source data are available online for this figure.
Figure 6
Figure 6. Models of the Hook3- and KIF1C-dependent assembly and activation of the cargo transport machinery.
(A) Structural model of the KIF1C-bound FHF complex constructed by superimposition of the three complexes shown in Fig. EV5: FTS(66–276)−Hook3(627–715) − FHIP1B(32–953) complex (Fig. EV5A; PDB code: 8QAT) (Abid Ali et al, ; Data ref: Abid Ali et al, 2025), Hook3(553–624) − KIF1C(714–809) complex (Fig. EV5B; PDB code: 9KO8), and AlphaFold2-predicted Hook3(553–718) − KIF1C(714–840) complex. (B) Molecular model depicting the assembly and activation of the Hook3- and KIF1C-dependent anterograde cargo transport machinery (Abid Ali et al, ; Siddiqui et al, 2019). WT wild-type, YAFA Y757A ∙ F764A, VE V614E.
Figure EV1
Figure EV1. Crystal structure of Hook3(553–624).
(A) Crystal structure of apo Hook3(553–624; magenta and cyan) shown as ribbon representation. The amino- and carboxyl-termini of each polypeptide are indicated as N′ and C′, respectively. (B) Cartoon representation of superposed structures of Hook3(553–624) in the apo form (magenta and cyan) and in KIF1C(714–809; navy and beige)-bound form (pink and mint). Dashed lines linking α2 and α3 of KIF1C represent invisible regions in the crystal structure owing to poor electron density. (C) Crystal packing of apo Hook3(553–624). Two symmetry mates of apo Hook3(553–624) are shown as ribbon representation. The four Hook3 molecules are gradually colored from blue (N′; residue 553) to orange (C′; residue 624).
Figure EV2
Figure EV2. Coiled-coil conformation of Hook3.
(A) Two heptad repeat types present in Hook3(553–624). (Left) Hook3 residues are assigned by the heptad repeat position (ag). Hydrophobic residues involved in the intermolecular interaction for the coiled-coil formation are shaded in gray. (Right) Helical wheel representations. Black boxes indicate two different heptad repeat types in Hook3. (B) Dimeric interface of the Hook3 coiled coils is shown in pink and cyan. The key residues for the coiled-coil formation are represented as sticks with labels shown at the bottom (red, type I; blue, type II heptad repeat).
Figure EV3
Figure EV3. Detailed structural analysis of the Hook3 − KIF1C complex.
(A) Intramolecular hydrophobic interaction in KIF1C(714–809). Loops are indicated in gray and the α1, α2, and α3 helices are represented in yellow, green, and purple, respectively. Hydrophobic residues involved in protein folding are represented as sticks and labeled. (B) Hook3(553–624) homodimer is shown as an electrostatic surface representation together with bound KIF1C(714–809) colored in beige. The Hook3 residues (black, from one Hook3 protomer; white, from another molecule) that constitute a large extended hydrophobic surface are shown in sticks with labels. (C) Lysine residues of Hook3 previously reported to be cross-linked with those of KIF1C (Abid Ali et al, ; Data ref: Abid Ali et al, 2025) are represented on our Hook3 − KIF1C complex structure as sticks with labels. Among them, those in the proximity of the complex interface are shown in green, whereas the rest are represented in magenta.
Figure EV4
Figure EV4. Intracellular localization of Hook3 and KIF1C expressed separately.
(Top) Fluorescent images of RPE1 cells expressing KIF1C − EGFP or Hook3−FuRed at 16 h post transfection. Scale bars, 10 μm. (Bottom) Tail enrichment of KIF1C − EGFP and HooK3−FuRed in RPE1 cells. Tail/cytoplasm ratios of each protein were analyzed. Values are means ± standard error of the mean. ns, not significant by the Student’s two-tailed t test. WT wild-type, YAFA Y757A ∙ F764A, VE V614E.
Figure EV5
Figure EV5. Experimentally determined and AlphaFold2-predicted structures of Hook3-containing complexes.
(A) Cryo-EM structure of the FTS(66–276)−Hook3(627–715) − FHIP1B(32–953) complex (PDB code: 8QAT, Abid Ali et al, ; Data ref: Abid Ali et al, 2025). (B) Crystal structure of the Hook3(553–624) − KIF1C(714–809) complex (PDB code: 9KO8). (C) AlphaFold2-based structural model of the Hook3(553–718) − KIF1C(714–840) complex.

References

    1. Abid Ali F, Zwetsloot AJ, Stone CE, Morgan TE, Wademan RF, Carter AP, Straube A (2025) Cryo-EM structure of Fts-Hook3-FHIP1B at 3.2 Å resolution (https://www.rcsb.org/structure/8QAT). [DATASET]
    1. Abid Ali F, Zwetsloot AJ, Stone CE, Morgan TE, Wademan RF, Carter AP, Straube A (2025) KIF1C activates and extends dynein movement through the FHF cargo adapter. Nat Struct Mol Biol 32(4):756–766 - PMC - PubMed
    1. Adams PD, Afonine PV, Bunkoczi G, Chen VB, Davis IW, Echols N, Headd JJ, Hung LW, Kapral GJ, Grosse-Kunstleve RW et al (2010) PHENIX: a comprehensive Python-based system for macromolecular structure solution. Acta Crystallogr D Biol Crystallogr 66:213–221 - PMC - PubMed
    1. Barlan K, Gelfand VI (2017) Microtubule-based transport and the distribution, tethering, and organization of organelles. Cold Spring Harb Perspect Biol 9:a025817 - PMC - PubMed
    1. Bielska E, Schuster M, Roger Y, Berepiki A, Soanes DM, Talbot NJ, Steinberg G (2014) Hook is an adapter that coordinates kinesin-3 and dynein cargo attachment on early endosomes. J Cell Biol 204:989–1007 - PMC - PubMed

LinkOut - more resources