. 2025 Jul;31(7):2335-2341.
doi: 10.1038/s41591-025-03684-w. Epub 2025 May 1.

Modeling the impact of vaccine campaigns on the epidemic transmission dynamics of chikungunya virus outbreaks

Affiliations

Modeling the impact of vaccine campaigns on the epidemic transmission dynamics of chikungunya virus outbreaks

Pastor E Pérez-Estigarribia et al. Nat Med. 2025 Jul.

Abstract

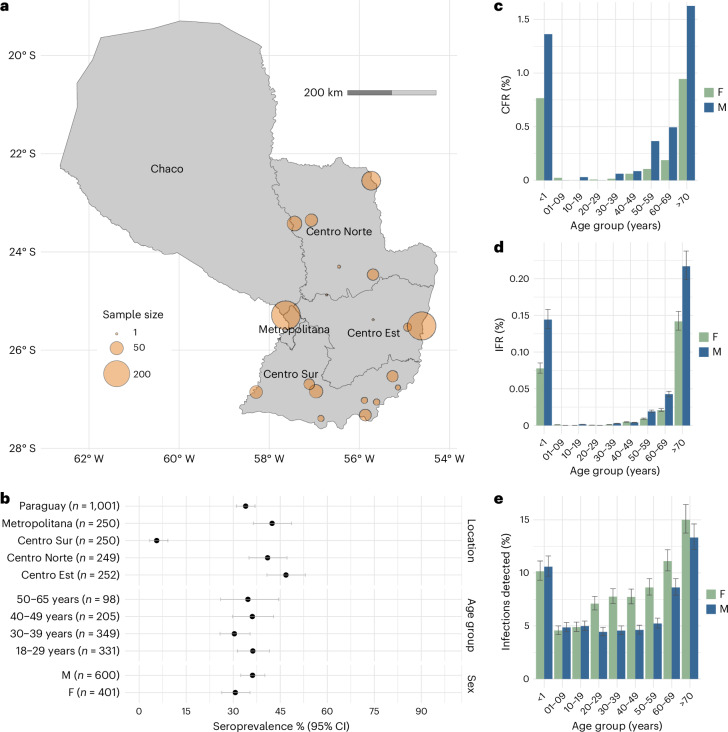
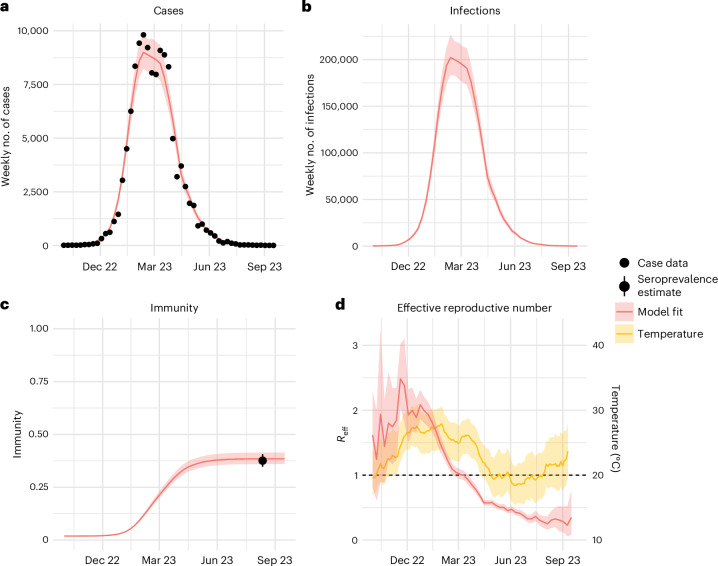
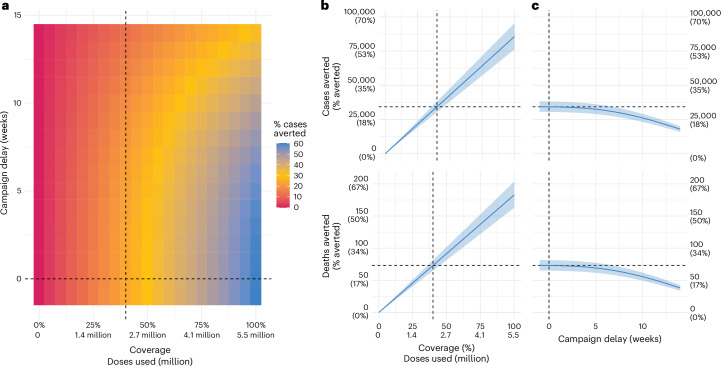
A licensed chikungunya vaccine now exists; however, it remains unclear whether it could be deployed during outbreaks to reduce the health burden. We used an epidemic in Paraguay as a case study. We conducted a seroprevalence study and used models to reconstruct epidemic transmission dynamics, providing a framework to assess the theoretical impact of a vaccine had it been available. We estimated that 33.0% (95% confidence interval (CI) 30.1-36.0%) of the population became infected during the outbreak. Of these individuals, 6.3% (95% CI 5.8-6.9%) were detected by the surveillance system, with a mean infection fatality ratio of 0.013% (95% CI 0.012-0.014%). A disease-blocking vaccine with 75% efficacy deployed in 40% of individuals aged ≥12 years over a 3-month period would have prevented 34,200 (95% CI 30,900-38,000) cases, representing 23% of all cases, and 73 (95% CI 66-81) deaths. If the vaccine also leads to infection blocking, 88% of cases would have been averted. These findings suggest that the vaccine is an important new tool to control outbreaks.


Conflict of interest statement

Competing interests: G.R.d.S. and H.S. are paid consultants for Valneva in support of their Phase IV studies. H.S. has also received consultancy support from the Gavi Alliance. The other authors declare no competing interests.

Figures

Fig. 1
Fig. 1. Reported case distribution.
a, Map with the mean incidence within the five subregions. b, Incidence by age and sex of reported cases. c, Number of deaths by age and sex.
Fig. 2
Fig. 2. Seroprevalence study and underlying risk of severe disease.
a, Location of samples by subregion. b, Seroprevalence by location, age and sex, with 95% CIs derived from a binomial distribution with varying sample sizes (n). c, CFR by age and sex. d, IFR by age and sex. e, Probability of severe disease (that is, probability of being detected by the surveillance system) by age and sex. The center points in d and e are derived from average seroprevalence values, and error bars are derived from the 95% CI of a binomial distribution (n = 1,001).
Fig. 3
Fig. 3. Mathematical model of the outbreak.
a, Weekly number of reported cases. b, Weekly number of infections inferred from the model. c, Evolution of the nationwide levels of immunity inferred by the model. The error bar is derived from the 95% CI of a binomial distribution (n = 1,001). d, Inferred effective reproductive number (Reff) and average, minimum and maximum temperature. In ad, model fit center lines are the median of the sampled posterior and model fit ribbons contain 95% of MCMC iterations.
Fig. 4
Fig. 4. Results of the vaccine model.
a, Proportion of cases averted for different values of coverage and delay. The dashed black line shows the base case scenario of 40% coverage with no delay between outbreak start and campaign vaccination. b, Cases (top row) and deaths (bottom row) averted when varying coverage and delay are fixed at 0 weeks. c, Cases (top row) and deaths (bottom row) averted when varying the delay between the detection of the outbreak and the start of the vaccine campaign, fixing coverage at 40%. In b and c, the ribbon represents propagated uncertainty from the epidemic model fit, where the vaccine impact is estimated using lower and upper epidemic parameter values.
Extended Data Fig. 1
Extended Data Fig. 1. Results of vaccine model - sensitivity with a 98% vaccine efficacy.
(a) Proportion of cases averted for different values of coverage and delay. The dashed black line shows the base case scenario of 40% coverage with no delay between outbreak start and campaign vaccination. (b) cases (top row) and deaths (bottom row) averted when varying coverage and delay are fixed at 0 weeks. (c) cases (top row) and deaths (bottom row) averted when varying the delay between the detection of the outbreak and the start of the vaccine campaign, fixing coverage at 40%.
Extended Data Fig. 2
Extended Data Fig. 2. Results of vaccine model - sensitivity with infection-blocking vaccine.
(a) Proportion of cases averted for different values of coverage and delay. The dashed black line shows the base case scenario of 40% coverage with no delay between outbreak start and campaign vaccination. (b) Infections (top row), cases (middle row) and deaths (bottom row) averted when varying coverage and delay are fixed at 0 weeks. (c) Infections (top row), cases (middle row) and deaths (bottom row) averted when varying the delay between the detection of the outbreak and the start of the vaccine campaign, fixing coverage at 40%.
Extended Data Fig. 3
Extended Data Fig. 3. History of reported cases by subregion.
(a) Chikungunya cases per week in Paraguay subregions between 2015–2023. (b) Cases reported on the same dates.
Extended Data Fig. 4
Extended Data Fig. 4. Impact of assuming equal infection risk across age and sex groups.
(a) Infection fatality ratio (IFR) calculated using overall seroprevalence (that is, where the same attack rate is assumed for all age/sex groups) vs IFR calculated using age and sex-specific seroprevalence (that is, where we use age/sex specific attack rates from the seroprevalence study, where this is available). Red dots are females, blue dots are males. (b) Infection fatality ratio (IFR) calculated using overall seroprevalence S against Case Fatality Ratio (CFR) calculated using age and sex-specific seroprevalence. Red dots are females, blue dots are males. The lines represent the results of a linear regression.

References

    1. Weaver, S. C. & Forrester, N. L. Chikungunya: evolutionary history and recent epidemic spread. Antiviral Res.120, 32–39 (2015). - PubMed
    1. Kang, H. et al. Chikungunya seroprevalence, force of infection, and prevalence of chronic disability after infection in endemic and epidemic settings: a systematic review, meta-analysis, and modelling study. Lancet Infect. Dis.24, 488–503 (2024). - PubMed
    1. O’Driscoll, M., Salje, H., Chang, A. Y. & Watson, H. Arthralgia resolution rate following chikungunya virus infection. Int. J. Infect. Dis.112, 1–7 (2021). - PMC - PubMed
    1. Salje, H. & Cortés Azuero, O. The deadly potential of chikungunya virus. Lancet Infect. Dis.24, 442–444 (2024). - PubMed
    1. de Souza, W. M. et al. Spatiotemporal dynamics and recurrence of chikungunya virus in Brazil: an epidemiological study. Lancet Microbe4, e319–e329 (2023). - PMC - PubMed

LinkOut - more resources