

Exploring leukocyte differential count ratio profiles as inflammatory biomarkers in diabetic retinopathy: a systematic review and meta-analysis
- PMID: 40312699
- PMCID: PMC12044949
- DOI: 10.1186/s12886-025-04075-y
Exploring leukocyte differential count ratio profiles as inflammatory biomarkers in diabetic retinopathy: a systematic review and meta-analysis
Abstract
Background: Diabetic retinopathy (DR) is increasingly prevalent and a major cause of irreversible blindness, particularly in developing countries. Limited access to ophthalmologists often leads to delayed diagnosis, emphasizing the need for more affordable and widely accessible screening methods to facilitate early identification. Recently, several studies have demonstrated variability in findings regarding the relationship between leukocyte differential count ratio biomarkers and DR. This study aims to investigate the association between leukocyte differential count ratios-NLR (Neutrophil-to-Lymphocyte Ratio), PLR (Platelet-to-Lymphocyte Ratio), MLR (Monocyte-to-Lymphocyte Ratio), and SII (Systemic Immune-Inflammation Index)-and the stages of diabetic retinopathy (DR).
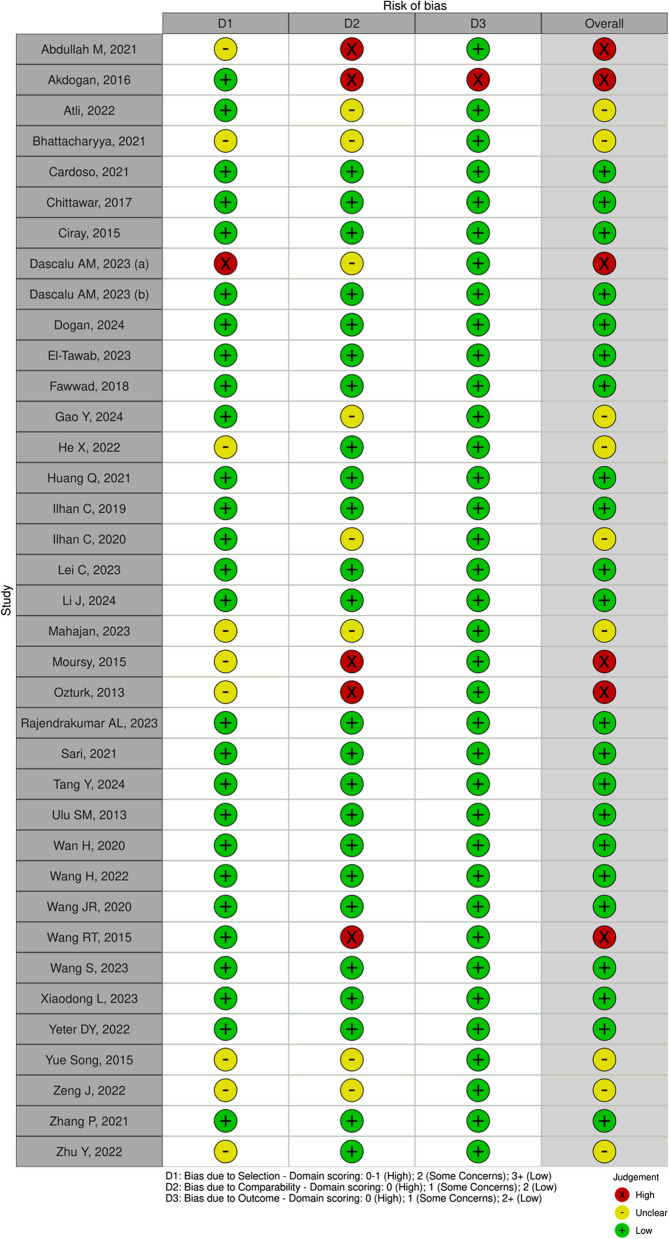
Methods: A comprehensive literature search was conducted across several databases up to September 2024, with a focus on identifying studies examining the relationship between the leukocyte differential count ratio profiles and diabetic retinopathy. Review Manager was used to conduct the meta-analyses. The Newcastle Ottawa Scale (NOS) were used to assess the included studies.
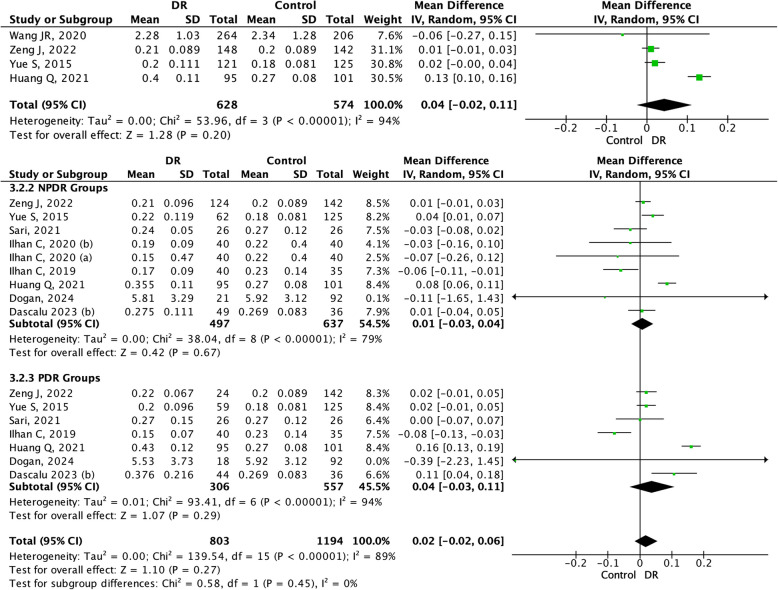
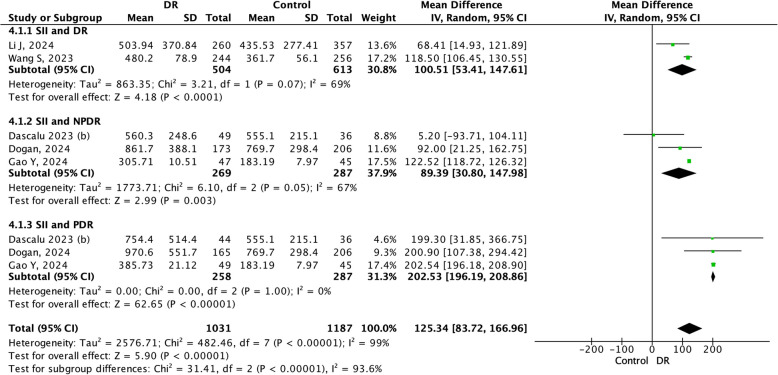
Results: A total of 38 studies were included in the systematic review and 27 studies were included in the meta-analysis. The mean differences in the NLR and PLR values were significantly different among the groups and were higher in the PDR group (0.68 (95%CI 0.42-0.95, p < 0.05) and 19.57 (95%CI 10.68-28.46, p < 0.05; respectively). These findings were followed by significant differences in SII value 202.53 (95% CI 196.19-208.86, p < 0.05). Moreover, the MLR values were not significantly different among the groups (p > 0.05).
Conclusion: NLR, PLR, and SII are associated with both the presence and progression of DR, with increasing levels of NLR and PLR reflecting a higher risk and severity of the disease. However, it is still necessary to justify the need to combine them with other clinical parameters to confirm the diagnosis.
Keywords: Biomarker; Diabetic retinopathy; Lymphocyte; Monocyte; Neutrophil; Platelet.
© 2025. The Author(s).
Conflict of interest statement
Declarations. Ethics approval and consent to participate: Not applicable. Consent for publication: Not applicable. Competing interests: The authors declare no competing interests.
Figures


References
-
- Sasongko MB, Widyaputri F, Agni AN, Wardhana FS, Kotha S, Gupta P, et al. Prevalence of Diabetic Retinopathy and Blindness in Indonesian Adults With Type 2 Diabetes. Am J Ophthalmol. 2017;181:79–87. Available from: http://www.ajo.com/article/S0002939417302714/fulltext. Cited 2024 Jun 27. - PubMed
-
- Teo ZL, Tham YC, Yu M, Chee ML, Rim TH, Cheung N, et al. Global Prevalence of Diabetic Retinopathy and Projection of Burden through 2045: Systematic Review and Meta-analysis. Ophthalmology. 2021;128(11):1580–91. Available from: http://www.aaojournal.org/article/S0161642021003213/fulltext. Cited 2024 Jul 3. - PubMed
-
- Yu Y, Chen H, Su SB. Neuroinflammatory responses in diabetic retinopathy. J Neuroinflammation. 2015;12(1):1–15. Available from: https://jneuroinflammation.biomedcentral.com/articles/10.1186/s12974-015.... Cited 2024 Mar 7. - DOI - PMC - PubMed
-
- Wu F, Phone A, Lamy R, Ma D, Laotaweerungsawat S, Chen Y, et al. Correlation of Aqueous, Vitreous, and Plasma Cytokine Levels in Patients With Proliferative Diabetic Retinopathy. Invest Ophthalmol Vis Sci. 2020;61(2). Available from: https://pubmed.ncbi.nlm.nih.gov/32084272/. Cited 2024 Aug 17. - PMC - PubMed
Publication types
MeSH terms
Substances
LinkOut - more resources
Full Text Sources
Medical
