

This is a preprint.
Skeletal muscle biomarkers of amyotrophic lateral sclerosis: a large-scale, multi-cohort proteomic study
- PMID: 40313273
- PMCID: PMC12045418
- DOI: 10.1101/2025.04.23.25326161
Skeletal muscle biomarkers of amyotrophic lateral sclerosis: a large-scale, multi-cohort proteomic study
Update in
-
Skeletal Muscle Biomarkers of Amyotrophic Lateral Sclerosis: A Large-Scale, Multi-Cohort Proteomic Study.Ann Neurol. 2026 Feb;99(2):393-407. doi: 10.1002/ana.78046. Epub 2025 Sep 29. Ann Neurol. 2026. PMID: 41020397
Abstract
Background: Biomarkers with clear contexts-of-use are important tools for ALS therapy development. Understanding their longitudinal trajectory in the untreated state is key to their use as potential markers of pharmacodynamic response. To this end, we undertook a large-scale proteomic study in well-phenotyped cohorts to identify biomarker candidates of ALS disease state and disease progression.
Methods: Clinical phenotypic data and biofluid samples, collected from patients with ALS and healthy controls through multiple longitudinal natural history studies, were used to identify biomarker candidates. SOMAmer (Slow Off-rate Modified Aptamer)-based relatively quantitative measurement of ~7,000 proteins was performed in plasma and CSF, with immunoassay validation of candidates of interest.
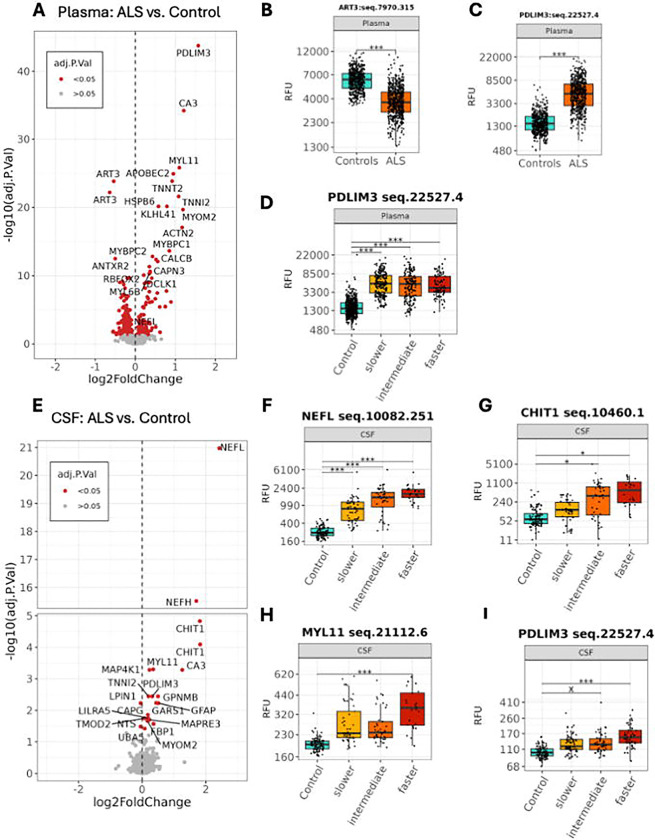
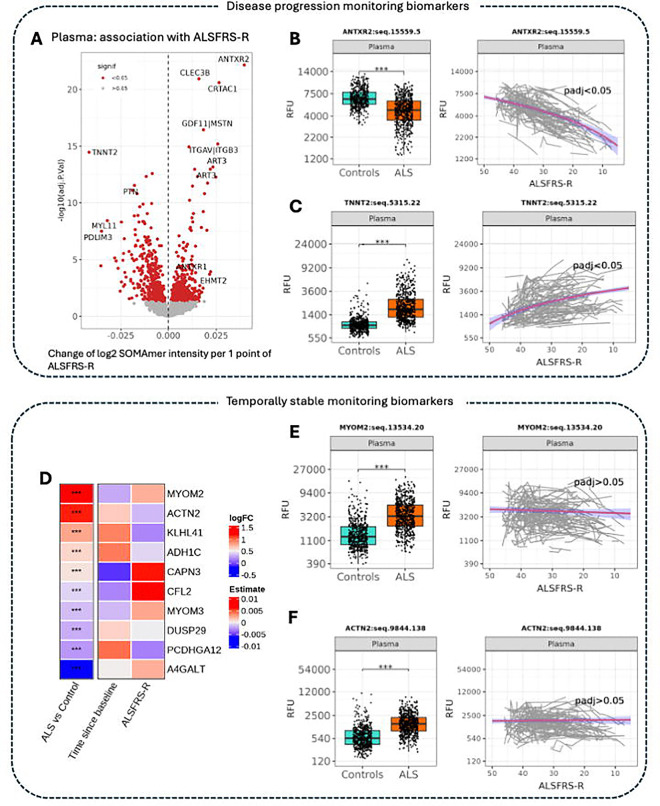
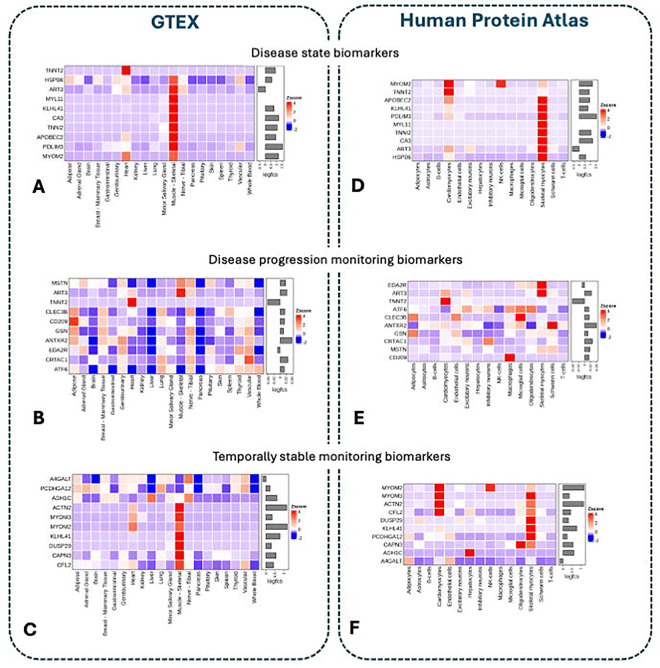
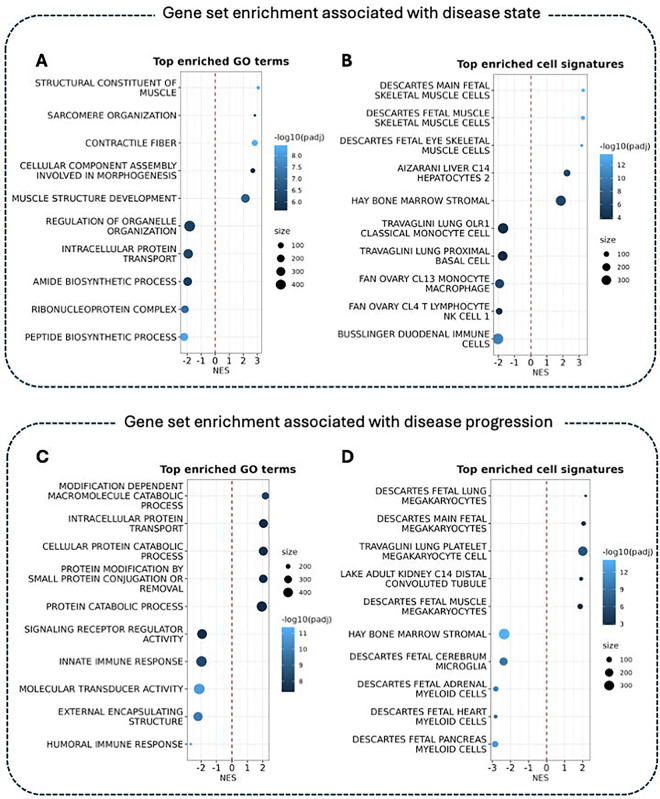
Results: We identified 329 plasma proteins significantly differentially regulated between ALS and controls (adjusted p-value <0.05), with 25 showing >40% relative abundance. PDLIM3, TNNT2, and MYL11 had the greatest log-fold elevation, while ANTXR2 and ART3 had the greatest log-fold reduction. A similar set of plasma proteins was found to increase (e.g. PDLIM3, TNNT2, MYL11) or decrease (e.g. ANTXR2, ART3, MSTN) with disease progression. CSF proteins with the greatest log-fold elevation included NEFL, NEFH, CHIT1, CA3, MYL11 and GPNMB. These results were confirmed in an independent replication cohort. Moreover, tissue-specific signature enrichment suggests a significant contribution of muscle as a source of these biomarkers. Immunoassays provided orthogonal validation of plasma TNNT2 and CSF GPNMB.
Conclusion: We identified an array of novel biomarkers with the potential to serve as response biomarkers to aid therapy development, as well as to shed light on the underlying biology of disease.
Keywords: context of use; disease progression biomarkers; disease state biomarkers; monitoring biomarkers; pharmacodynamic response biomarkers.
Conflict of interest statement
Competing interests OD, MK-H, RS, LY, MBidinosti, LF, MN., LLJ, LIB, SB are employees and shareholders of Novartis. JW reports research support from the National Institutes of Health, the ALS Association, and the Department of Defense. AM reports consulting fees from Roche, Pfizer, Accure Therapeutics, Novartis and Trace Neuroscience. He has received grant funding from MRC, NIHR, Wellcome Trust, My Name’5 Doddie Foundation, LifeArc and Target ALS. He reports Biomarkers data licensing to Biogen and Clinical Trial data to ILTOO. VG is currently employed by and with stock holdings at Biohaven Pharmaceuticals. JPH and AC report no competing interests. JDB reports consulting fees from Trace Neuroscience, Biogen, MT Pharma of America, MT Pharma Holdings of America, Janssen, Alexion, Regeneron, and Amylyx. He has received research support from Biogen, Clene Nanomedicine, MT Pharma of America, MT Pharma Holdings of America, Alexion, Amylyx, Rapa Therapeutics, Brainstorm Cell Therapeutics, ProJenX, MDA, ALSA, ALS Finding A Cure, ALS One, Tambourine, DoD, and NINDS. He has been a paid educational speaker for PeerView and Projects in Knowledge. MBenatar reports grants from the National Institutes of Health, the ALS Association, the Muscular Dystrophy Association, and the Department of Defense; as well as consulting fees from Alaunos, Alector, Alexion, Amgen, Annexon, Arrowhead, Biogen, Bristol Myers Squibb, Canopy, Cartesian, CorEvitas, Denali, Eli Lilly, Immunovant, Janssen, Merck, Novartis, Prilenia, Roche, Sanofi, Takeda, UCB, uniQure, and Woolsey. The University of Miami has licensed intellectual property to Biogen to support design of the ATLAS study.
Figures
References
-
- Bensimon G, Lacomblez L, Meninger V, and the ALS/Riluzole study group. A controlled trial of riluzole in amyotrophic lateral sclerosis. New England Journal of Medicine 1994; 330: 585–91. - PubMed
-
- The Writing Group on behalf of the Edaravone (MCI-186) ALS 19 Study Group. Safety and efficacy of edaravone in well defined patients with amyotrophic lateral sclerosis: a randomised, double-blind, placebo-controlled trial. Lancet Neurol 2017; 16(7): 505–12. - PubMed
-
- Miller TM, Cudkowicz ME, Genge A, et al. Trial of Antisense Oligonucleotide Tofersen for SOD1 ALS. The New England journal of medicine 2022; 387(12): 1099–110. - PubMed
-
- FDA-NIH Biomarker Working Group. BEST (Biomarkers, EndpointS, and other Tools) Resource. Silver Spring (MD): Food and Drug Administration (US). Co-published by National Institutes of Health (US), Bethesda (MD); 2016. - PubMed
Publication types
Grants and funding
LinkOut - more resources
Full Text Sources
Research Materials
Miscellaneous