

This is a preprint.
Genomic Epidemiology of Healthcare-Associated Respiratory Virus Infections
- PMID: 40313286
- PMCID: PMC12045434
- DOI: 10.1101/2025.04.20.25325828
Genomic Epidemiology of Healthcare-Associated Respiratory Virus Infections
Update in
-
Genomic epidemiology of healthcare-associated respiratory virus infections in Pittsburgh, Pennsylvania, 2018-2020.Infect Control Hosp Epidemiol. 2025 Nov 4:1-11. doi: 10.1017/ice.2025.10328. Online ahead of print. Infect Control Hosp Epidemiol. 2025. PMID: 41185586
Abstract
Background: Respiratory virus transmission in healthcare settings is not well understood. To investigate the transmission dynamics of common healthcare-associated respiratory virus infections, we performed retrospective whole genome sequencing (WGS) surveillance at one pediatric and two adult teaching hospitals in Pittsburgh, PA.
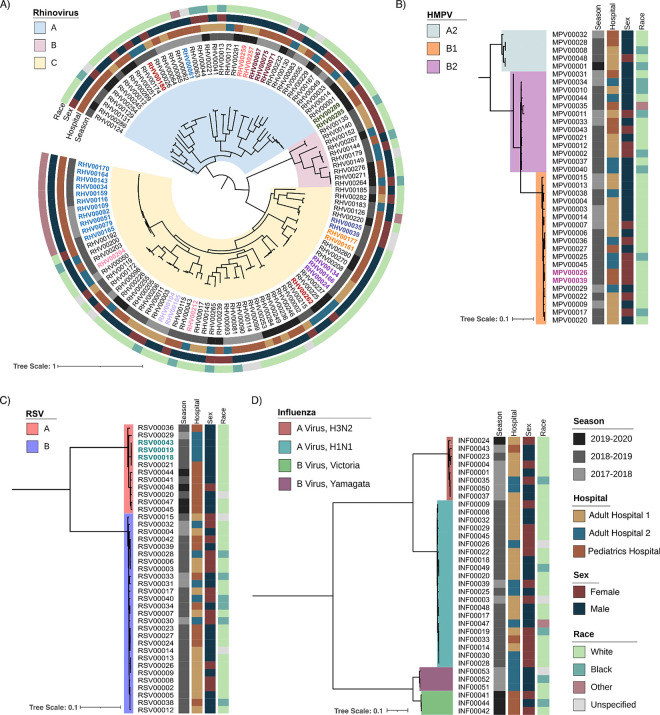
Methods: From January 2, 2018, to January 4, 2020, nasal swab specimens positive for rhinovirus, influenza, human metapneumovirus (HMPV), or respiratory syncytial virus (RSV) from patients hospitalized for ≥3 days were sequenced on Illumina platform. High-quality genomes were assessed for genetic relatedness using ≤3 single nucleotide polymorphisms (SNPs) cut-off, except for rhinovirus (10 SNPs). Patient health records were reviewed for genetically related clusters to identify epidemiological connections.
Results: We collected 436 viral specimens from 359 patients: rhinovirus (n=291), influenza (n=50), HMPV (n=47), and RSV (n=48). Of these, 55% (197/359 patients) were from pediatric hospital and 45% from adult hospitals. Patients ranged in age from 14 days to 93 years, 61% were male, and 74% were white. WGS was performed on 61.2% (178/291) rhinovirus, 78% (39/50) influenza, 92% (44/48) RSV, and all HMPV specimens. Among high-quality genomes, we identified 14 genetically related clusters involving 36 patients, ranging in size from 2-5 patients. We identified common epidemiological links for 53% (19/36) of clustered patients; 63% (12/19) patients had same-unit stay, 26% (5/19) had overlapping hospital stays, and 11% (2/19) shared common provider. On average, genetically related clusters spanned 16 days (range:0-55 days).
Conclusion: WGS offered insights into respiratory virus transmission dynamics. These advancements could potentially improve infection prevention and control strategies, leading to enhanced patient safety and healthcare outcomes.
Keywords: genomic epidemiology; healthcare-associated infections; outbreak; respiratory viruses; whole genome sequencing.
Conflict of interest statement
Declaration of Interests None
Figures


References
-
- National Institute of Allergy and Infectious Diseases. Respiratory Syncytial Virus (RSV). October/15/2024]; Available from: https://www.niaid.nih.gov/diseases-conditions/respiratory-syncytial-viru....
Publication types
Grants and funding
LinkOut - more resources
Full Text Sources