

This is a preprint.
Validation of Angular Indication Measurement (AIM) Stereoacuity
- PMID: 40313306
- PMCID: PMC12045407
- DOI: 10.1101/2025.04.23.25325959
Validation of Angular Indication Measurement (AIM) Stereoacuity
Abstract
Background: Stereopsis is a critical visual function, however clinical stereotests are time-consuming, coarse in resolution, suffer low test-retest repeatability, and poor agreement with other tests. We developed AIM Stereoacuity to address these limitations and asked whether it could deliver reliable, efficient, and precise stereo-thresholds across stimulus types and disparity signs.
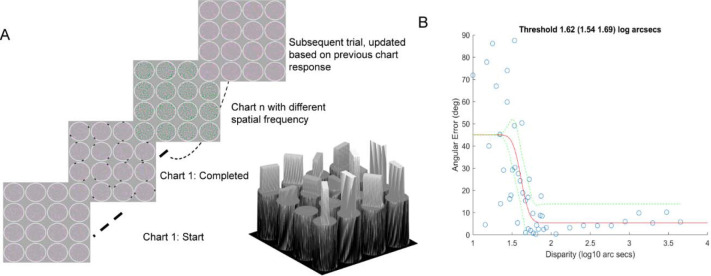
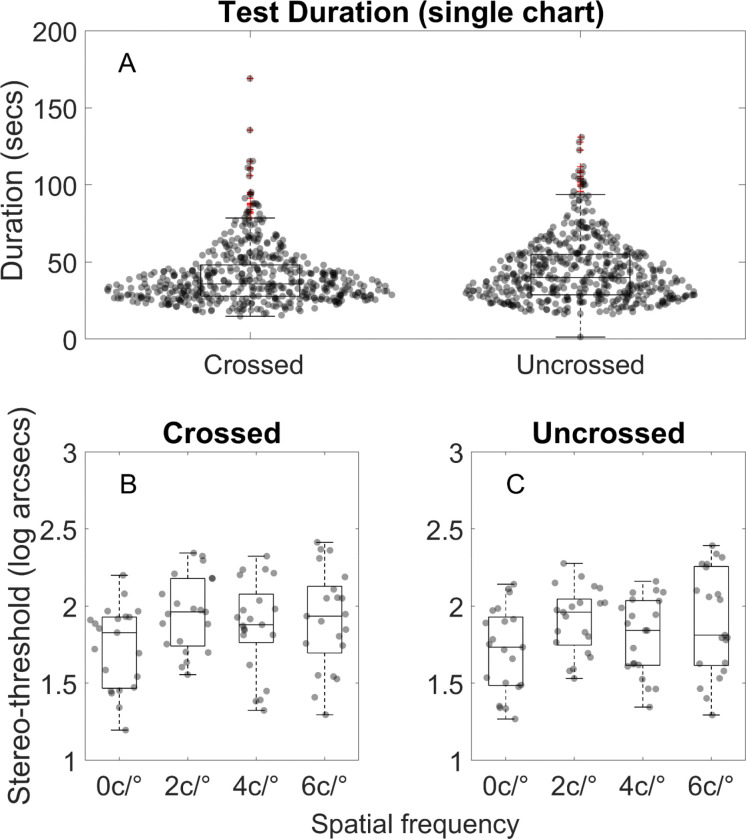
Methods: Observers reported the orientation of 5×1.25° bar defined by disparity of random dots embedded in a 6° diameter circular cell, presented in a 4*4 grid. Bar disparity was scaled from ± 2σ relative to a threshold and slope-estimate, initially set by the experimenter and adaptively updated. Orientation report errors (indicated vs. actual bar-orientation) were fit with a cumulative Gaussian function to derive stereo-thresholds. Twenty-one normally-sighted observers were tested with red-blue anaglyphs in crossed and uncrossed disparity signs across 4 element-types (8.5arcmin broadband dots, or band-pass difference of Gaussians with peak Spatial-Frequency (SF) of 2, 4, or 6 c/°). We analyzed stereoacuities, test durations, and the test-retest repeatability.
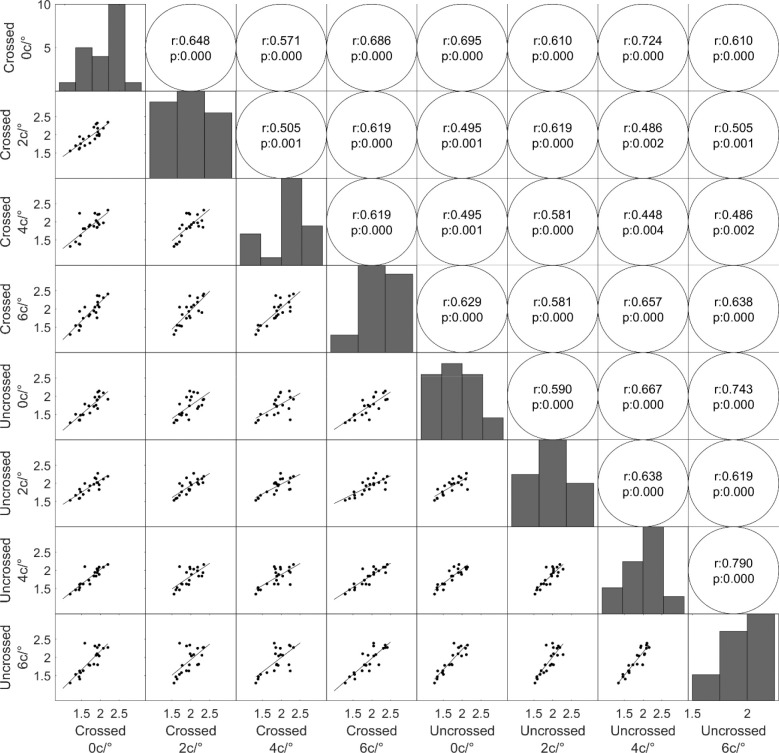
Results: Across SFs and observers, test duration for a chart were 36 and 40 secs for measuring crossed and uncrossed disparity, respectively. There was no effect of disparity sign or SF (Kruskal-Wallis; p>0.05). Median log stereo-thresholds averaged across all SFs were 1.90 and 1.84 log arcsec for crossed and uncrossed disparities, respectively. Crossed and uncrossed disparities were moderately correlated across SFs(r=0.44 to 0.79; median=0.54). Test-retest biases were 0.01 arcsec (p=0.45) and 0.10 arcsec (p= 0.001) for crossed and uncrossed disparities, respectively.
Conclusions: The results for the response-adaptive, self-administered AIM Stereoacuity method showed no significant stereo-thresholds differences between broad- and narrow-band stimuli. The test delivers repeatable results for crossed disparity in approximately 80 seconds.
Keywords: Depth perception; binocular vision; response-adaptive psychophysics; stereoacuity.
Conflict of interest statement
Conflict of Interest: AIM technologies are disclosed as patented (pending) and held by Northeastern University, Boston, USA. Title: Self-administered adaptive vision screening test using angular indication; Application PCT/US2023/012959 JS and PJB are founders and shareholders of PerZeption Inc, which has an exclusive license agreement for AIM with Northeastern University. SN declares that she has no conflict of interest.
Figures


Similar articles
-
Comparison of Two Modern Survival Prediction Tools, SORG-MLA and METSSS, in Patients With Symptomatic Long-bone Metastases Who Underwent Local Treatment With Surgery Followed by Radiotherapy and With Radiotherapy Alone.Clin Orthop Relat Res. 2024 Dec 1;482(12):2193-2208. doi: 10.1097/CORR.0000000000003185. Epub 2024 Jul 23. Clin Orthop Relat Res. 2024. PMID: 39051924
-
Interventions for improving adherence to amblyopia treatments in children.Cochrane Database Syst Rev. 2025 Jul 2;7(7):CD015820. doi: 10.1002/14651858.CD015820.pub2. Cochrane Database Syst Rev. 2025. PMID: 40600348
-
Direct-acting antivirals for chronic hepatitis C.Cochrane Database Syst Rev. 2017 Jun 6;6(6):CD012143. doi: 10.1002/14651858.CD012143.pub2. Cochrane Database Syst Rev. 2017. Update in: Cochrane Database Syst Rev. 2017 Sep 18;9:CD012143. doi: 10.1002/14651858.CD012143.pub3. PMID: 28585310 Free PMC article. Updated.
-
Interventions for treating supracondylar elbow fractures in children.Cochrane Database Syst Rev. 2022 Jun 9;6(6):CD013609. doi: 10.1002/14651858.CD013609.pub2. Cochrane Database Syst Rev. 2022. PMID: 35678077 Free PMC article.
-
[Volume and health outcomes: evidence from systematic reviews and from evaluation of Italian hospital data].Epidemiol Prev. 2013 Mar-Jun;37(2-3 Suppl 2):1-100. Epidemiol Prev. 2013. PMID: 23851286 Italian.
References
-
- O’Connor AR, Birch EE, Anderson S, Draper H. The functional significance of stereopsis. Invest Ophthalmol Vis Sci. 2010;51(4):2019–23. - PubMed
-
- Long J, Siu C. Randot stereoacuity does not accurately predict ability to perform two practical tests of depth perception at a near distance. Optometry and vision science. 2005;82(10):912–5. - PubMed
-
- Adler P, Scally AJ, Barrett BT. Test–retest variability of Randot stereoacuity measures gathered in an unselected sample of UK primary school children. British journal of ophthalmology. 2012;96(5):656–61. - PubMed
Publication types
Grants and funding
LinkOut - more resources
Full Text Sources