In situ monitoring of ligand-to-metal energy transfer in combination with synchrotron-based X-ray diffraction methods to elucidate the synthesis mechanism and structural evolution of lanthanide complexes
- PMID: 40313400
- PMCID: PMC12044340
- DOI: 10.3389/fchem.2025.1536383
In situ monitoring of ligand-to-metal energy transfer in combination with synchrotron-based X-ray diffraction methods to elucidate the synthesis mechanism and structural evolution of lanthanide complexes
Abstract
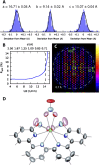
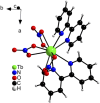
Despite wide application of lanthanide complexes in solar cells, light-emitting diodes and sensors, their crystallization mechanisms have not been studied in detail. Further investigations of this kind can lead to the development of targeted synthesis protocols and tailoring of their structure-related physical properties. In this work, the structural evolution during the synthesis of the luminescent [Tb (bipy)2(NO3)3] (bipy = 2,2'-bipyridine) complex is studied by monitoring the ligand-to-metal energy transfer through in situ luminescence measurements combined with synchrotron-based X-ray diffraction (XRD) analysis. These experiments reveal an interesting crystallization pathway involving the formation of a reaction intermediate that is dependent on parameters such as ligand-to-metal molar ratios. In addition, the structure of [Tb (bipy)2(NO3)3] is solved from serial crystallography data collected at a microfocused synchrotron X-ray beamline. This is an emerging technique that can be used to interrogate individual crystallites and overcome beam damage effects. The resulting structure is found to correspond to that determined by classical single crystal XRD, and a perspective on realizing future in situ measurements of this type is given. This work therefore describes multiple advancements combining crystallite-specific diffraction probes and in situ techniques to track the synthesis kinetics of luminescent materials.
Keywords: In situ luminescence; crystal structure; lanthanide complexes; ligand-to-metal energy transfer; small-molecule serial crystallography; synchrotron radiation.
Copyright © 2025 Al-Tayyem, Müscher-Polzin, Pande, Yefanov, Mariani, Burkhardt, Chapman, Näther, Braun, Radke, Waitschat, Beyerlein and Terraschke.
Conflict of interest statement
The authors declare that the research was conducted in the absence of any commercial or financial relationships that could be construed as a potential conflict of interest.
Figures


Similar articles
-
From ligand exchange to reaction intermediates: what does really happen during the synthesis of emissive complexes?Phys Chem Chem Phys. 2018 Mar 14;20(11):7428-7437. doi: 10.1039/c7cp07142f. Phys Chem Chem Phys. 2018. PMID: 29323378
-
DNA Intercalating Near-Infrared Luminescent Lanthanide Complexes Containing Dipyrido[3,2-a:2',3'-c]phenazine (dppz) Ligands: Synthesis, Crystal Structures, Stability, Luminescence Properties and CT-DNA Interaction.Molecules. 2020 Nov 13;25(22):5309. doi: 10.3390/molecules25225309. Molecules. 2020. PMID: 33203056 Free PMC article.
-
Luminescent lanthanide complexes of a bis-bipyridine-phosphine-oxide ligand as tools for anion detection.J Am Chem Soc. 2002 Jul 3;124(26):7779-88. doi: 10.1021/ja0200847. J Am Chem Soc. 2002. PMID: 12083932
-
Structural and photophysical properties of coordination networks combining [Ru(bipy)(CN)4]2- anions and lanthanide(III) cations: rates of photoinduced Ru-to-lanthanide energy transfer and sensitized near-infrared luminescence.Inorg Chem. 2005 Jun 27;44(13):4656-65. doi: 10.1021/ic050512k. Inorg Chem. 2005. PMID: 15962974
-
Current advances in synchrotron radiation instrumentation for MX experiments.Arch Biochem Biophys. 2016 Jul 15;602:21-31. doi: 10.1016/j.abb.2016.03.021. Epub 2016 Apr 1. Arch Biochem Biophys. 2016. PMID: 27046341 Free PMC article. Review.
References
-
- Arana L. R., Lindenberg P., Said H., Radke M., Heidenreich N., Cunha C. S., et al. (2017). Monitoring the mechanism of formation of [Ce(1,10-phenanthroline) 2 (NO 3) 3 ] by in situ luminescence analysis of 5d–4f electronic transitions. RSC Adv 7 (83), 52794–52800. 10.1039/C7RA07488C - DOI
LinkOut - more resources
Full Text Sources

