. 2025 Mar 25;6(1):73-84.
doi: 10.12336/biomatertransl.2025.01.006. eCollection 2025.

Living hybrid material based on probiotic with photothermal properties inhibits PD-L1 expression after tumouricidal photothermal therapy

Affiliations

Living hybrid material based on probiotic with photothermal properties inhibits PD-L1 expression after tumouricidal photothermal therapy

Ning Jiang et al. Biomater Transl. .

Abstract

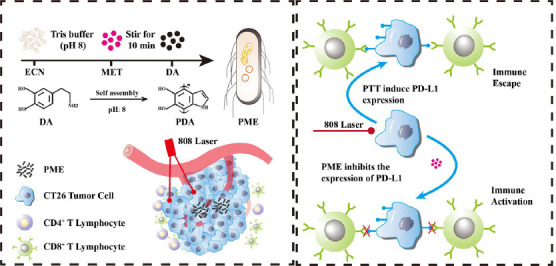
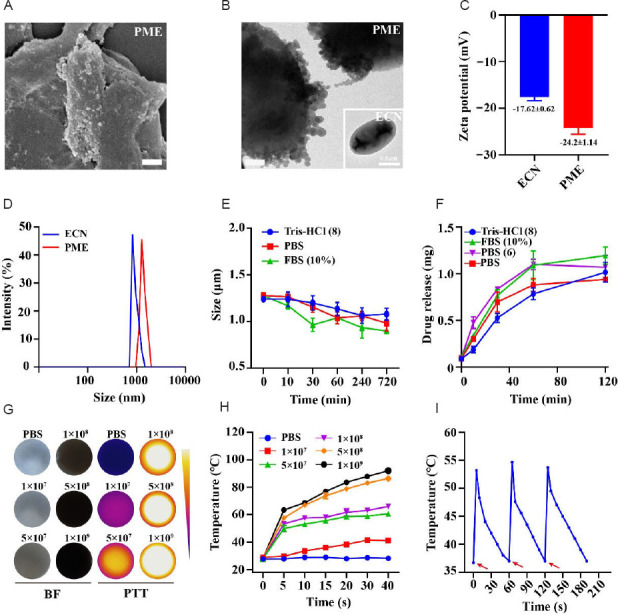
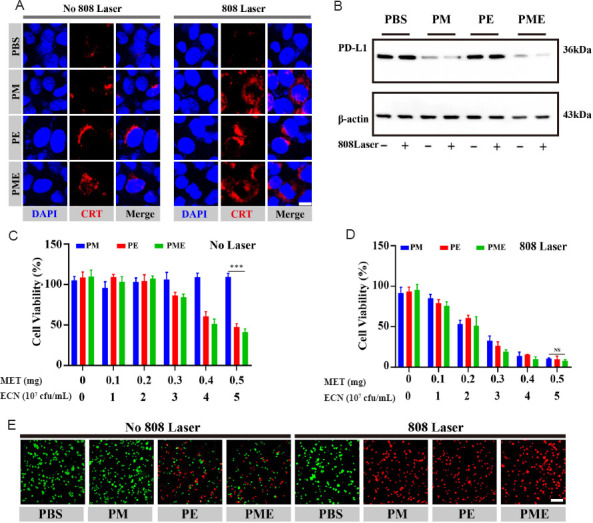
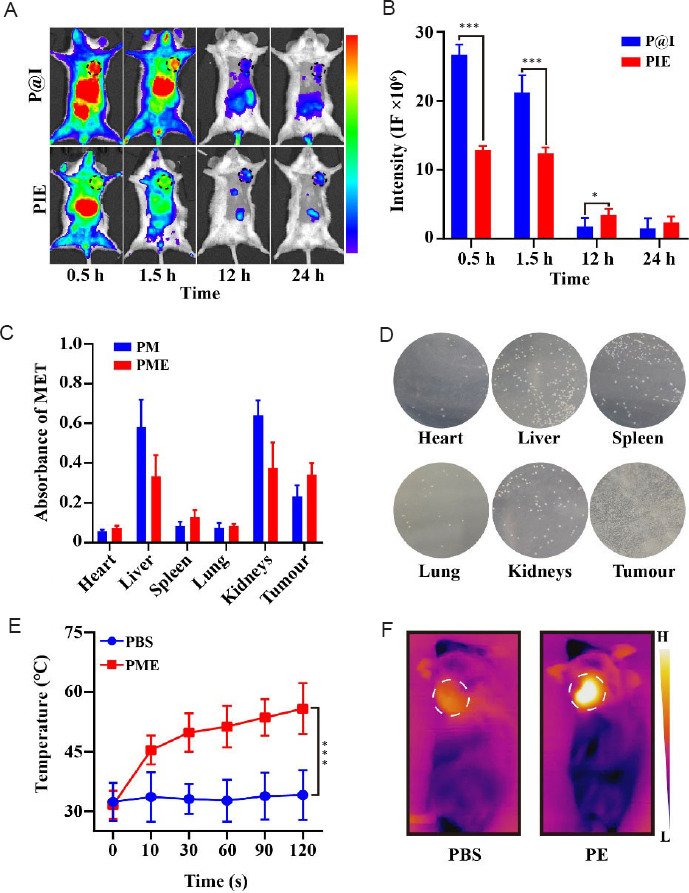
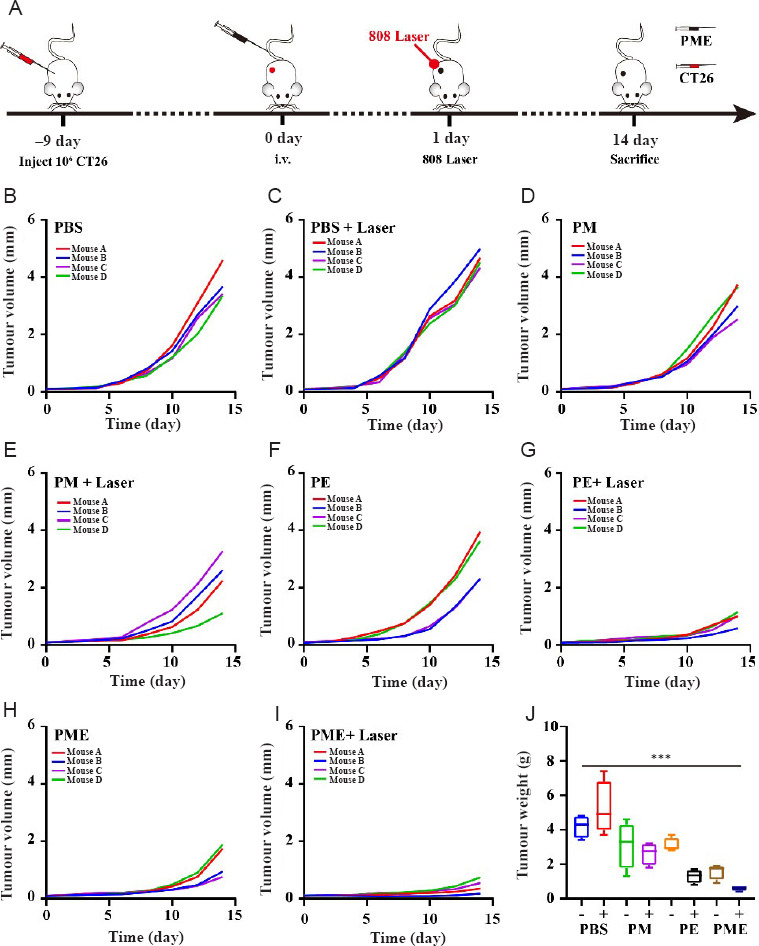
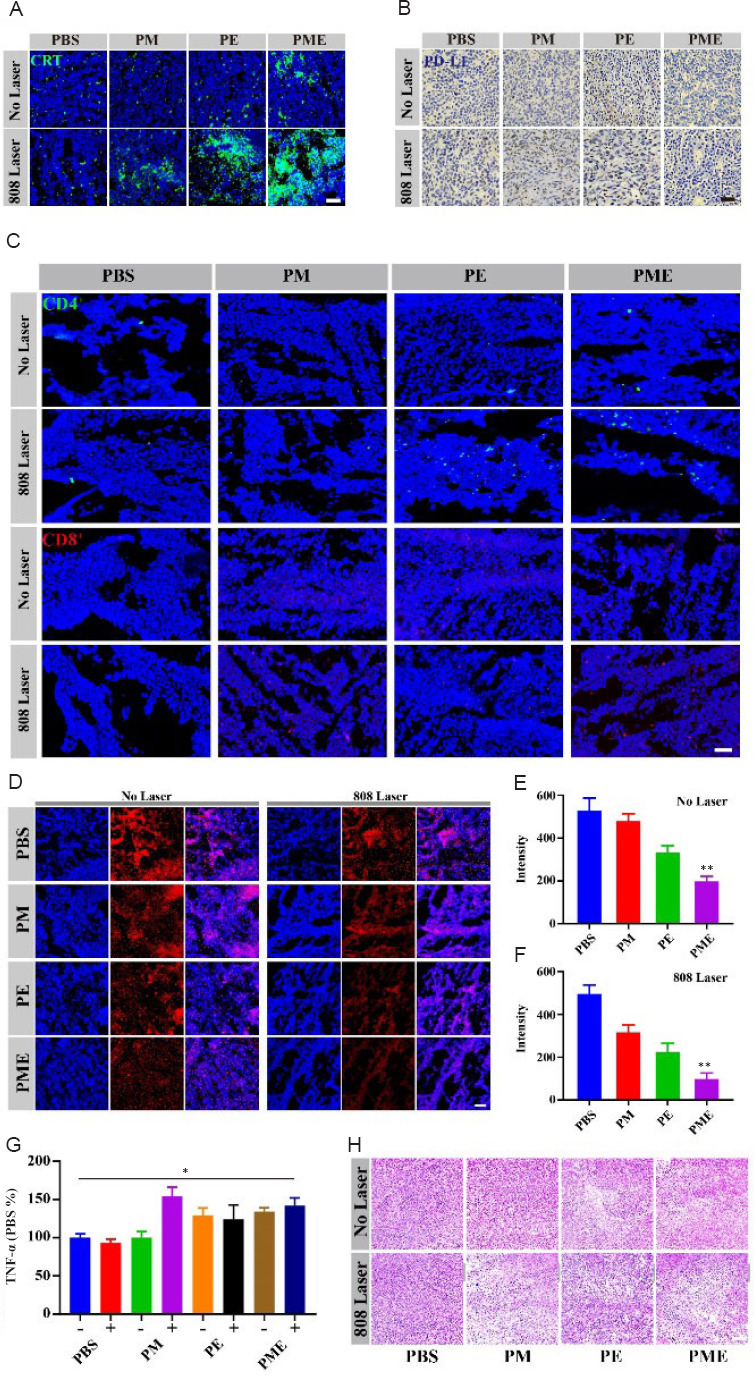
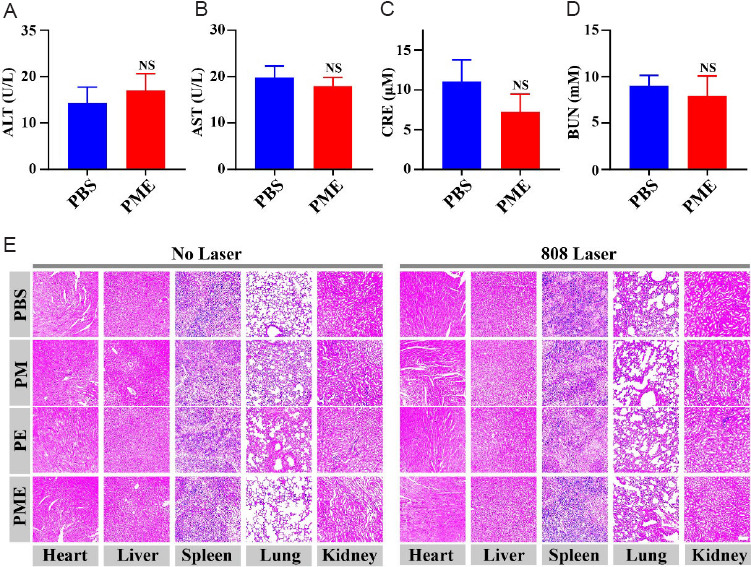
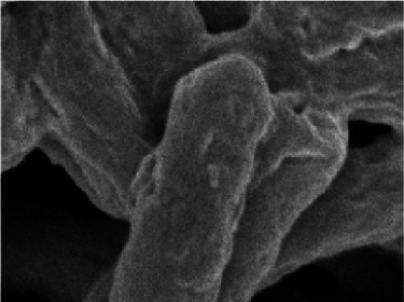
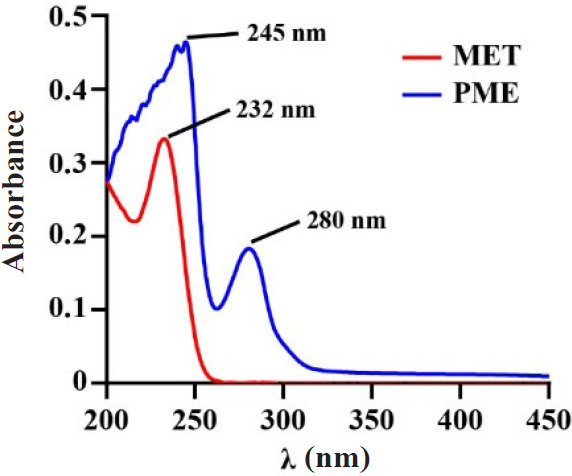
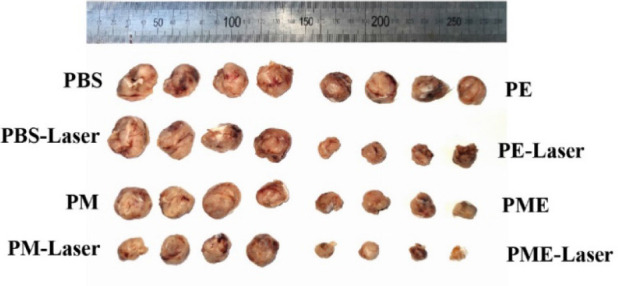
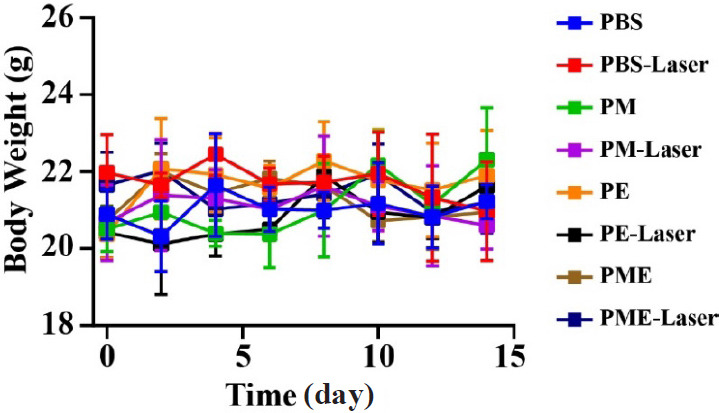
Photothermal therapy is a safe and effective tumour treatment strategy due to its excellent spatiotemporal controllability. However, interferon gamma in the tumour microenvironment is upregulated after photothermal therapy, which enhances the expression of programmed cell death ligand 1 (PD-L1) in tumour cells. This further promotes immunosuppression and tumour metastasis, resulting in a poor prognosis in cancer therapy. Traditional nanodrugs often face challenges in penetrating the dense extracellular matrix of solid tumours, whereas certain probiotics possess the ability to specifically colonise the core regions of tumours. In this research, we used Escherichia coli Nissle 1917 (ECN) as a chassis cell and self-assembly polydopamine (PDA) on the ECN surface. The black PDA@ECN (notes as PE) actively colonises at the tumour site and produces a photothermal effect under 808 nm laser irradiation to kill tumour cells. To overcome the high expression of PD-L1 induced after photothermal therapy, metformin (MET) was also encapsulated in PE to form PDA@MET@ECN (notes as PME). In vivo experiments demonstrated that PME effectively inhibited the PD-L1 expression and growth of CT26 tumour cells. Overall, PME reverses the immunosuppressive tumour microenvironment and enhances the effect of photothermal/immune therapy in tumour treatment.

Keywords: Escherichia coli Nissle 1917; biomaterials; photothermal therapy; programmed cell death ligand 1.


Conflict of interest statement

Conflicts of interest statement: The authors declare no conflicts of interest.

Figures

Figure 1.
Figure 1.. The synthesis route of PME and the mechanism of enhancing the anti-tumour effect by PTT and inhibition PD-L1 expression in the tumour microenvironment. Created with Adobe Illustrator 2019. DA: dopamine; ECN: Escherichia coli Nissle 1917; MET: metformin; PDA: polydopamine; PD-L1: programmed cell death ligand 1; PME: PDA@MET@ECN; PTT: photothermal therapy.
Figure 2.
Figure 2.. Characterisation of the PME. (A) Representative SEM image of the prepared PME. Scale bar: 200 nm. (B) Representative TEM image of the prepared PME. Scale bar: 200 nm. (C) Zeta potential of ECN and PME (n = 3). (D) The size of ECN, and PME by DLS (n = 3). (E) The stable of PME in various buffer by DLS (n = 3). (F) Release of MET from PME in various buffers (n = 3). (G, H) Thermal images and temperature variation of different concentrations of PME (calculated by ECN) exposed to 0.5 W/cm laser (n = 3). (I) Repeated irradiation performance of PME. The red arrow indicates irradiation. Data are demonstrated as mean ± SD. BF: bright field; DLS: dynamic light scattering; ECN: Escherichia coli Nissle 1917; FBS: foetal bovine serum; MET: metformin; PBS: phosphate buffered saline; PDA: polydopamine; PME: PDA@MET@ECN; PTT: photothermal therapy; SEM: scanning electron microscope; TEM: transmission electron microscope.
Figure 3.
Figure 3.. PME inhibits PD-L1 expression in vitro. (A) Representative immunofluorescence images of CRT exposure after various treatments. Scale bar: 10 µm. (B) PME inhibited the expression of PD-L1 protein in CT26 tumour cells after 24-hour treatments. (C, D) Cell viability of CT26 tumour cells detected by Cell Counting Kit-8 assay (n = 3). (E) Representative images of CT26 tumour cells after various treatments. Scale bar: 50 µm. Data are demonstrated as mean ± SD. ***P < 0.001 (one-way analysis of variance). CRT: calprotectin; DAPI: 4′,6-diamidino-2-phenylindole; ECN: Escherichia coli Nissle 1917; MET: metformin; NS: no significant difference; PBS: phosphate buffered saline; PD-L1: programmed cell death ligand 1; PDA: polydopamine; PME: PDA@MET@ECN.
Figure 4.
Figure 4.. Pharmacokinetics and biodistribution of PME in vivo. (A) Real-time NIR fluorescence images of the CT26 tumour-bearing mice after intravenous injection of P@I or PIE . (B) Quantitative analysis of fluorescence intensity at tumour site (n = 3). (C) Quantification of MET concentration in tumours and normal tissues at 24 hours after PM or PME treatments (n = 3). (D) The distribution of ECN in tumours and normal tissues at 24 hours after PME treatments. (E) The temperature in CT26 tumours after NIR laser irradiation (n = 3). The mice were pre-treated with PME for 24 hours. (F) Representative in vivo infrared thermal images of CT26 tumours irradiated 10 seconds at 0.5 W/cm for twice at 24 hours. Data are demonstrated as mean ± SD. *P < 0.05, ***P < 0.001 (one-way analysis of variance). ECN: Escherichia coli Nissle 1917; H: high; ICG: indocyanine green; IF: intensity of fluorescence; L: low; MET: metformin; P@I: PDA@ICG; PDA: polydopamine; PBS: phosphate buffered saline; PIE: PDA@ICG@ECN; PE: PDA@ECN; PM: PDA@MET; PME: PDA@MET@ECN.
Figure 5.
Figure 5.. In vivo anti-tumour efficacy of PME-mediated PTT in CT26 tumours. (A) Schematic diagram of CT26 tumour experimental design. (B-I) Tumour growth curves of CT26 tumour-bearing mice after the various treatments (n = 4). (J) Weights of excised distal CT26 tumours (n = 4). Data are demonstrated as mean ± SD. ***P < 0.001 (one-way analysis of variance). ECN: Escherichia coli Nissle 1917; i.v.: intravenous injection; MET: metformin; PBS: phosphate buffered saline; PDA: polydopamine; PE: PDA@ECN; PM: PDA@MET; PME: PDA@MET@ECN; PTT: photothermal therapy.
Figure 6.
Figure 6.. Anti-tumour efficacy of PME in CT26 tumour bear mice in vivo. (A) Representative image of CRT staining after various treatments. Scale bar: 100 µm. (B) Representative image of PD-L1 staining after various treatments. Scale bar: 50 µm. (C) Quantification of CD4+ and CD8+ T cells in representative images. Scale bar: 100 µm. (D–F) Quantification and representative images of Ki67 staining. Scale bar: 100 µm. (G) The level of TNF-α in the serum after different treatments. – represents no laser, and represents laser. (H) Representative images of H&E staining of tumour slice after various treatments. Scale bar: 100 µm. Data are demonstrated as mean ± SD. *P < 0.05, **P < 0.01 (one-way analysis of variance). CRT: calprotectin; ECN: Escherichia coli Nissle 1917; H&E: haematoxylin and eosin; MET: metformin; PBS: phosphate buffered saline; PD-L1: programmed cell death ligand 1; PDA: polydopamine; PE: PDA@ECN; PM: PDA@MET; PME: PDA@MET@ECN; TNF-α: tumour necrosis factor-α.
Figure 7.
Figure 7.. Biosafety of PME in BALB/c mice. (A, B) Serum AST and ALT levels (n = 3). (C, D) Serum CRE and BUN levels (n = 3). (E) H&E staining images of the major organs on day 14. Scale bar: 100 µm. The data are presented as the means ± SD, and were analysed by two-tail Student’s t-test. ALT: alanine aminotransferase; AST: aspartate aminotransferase; BUN: blood urea nitrogen; CRE: creatinine; ECN: Escherichia coli Nissle 1917; H&E: haematoxylin and eosin; MET: metformin; NS: no significant difference; PDA: polydopamine; PBS: phosphate buffered saline; PE: PDA@ECN; PM: PDA@MET; PME: PDA@MET@ECN.
Additional Figure 1.
Additional Figure 1.. Representative SEM image of the prepared ECN. Scale bar: 500 nm. ECN: Escherichia coli Nissle 1917; SEM: scanning electron microscope.
Additional Figure 2.
Additional Figure 2.. Characteristic absorption peak of MET and PME by ultraviolet-visible spectroscopy. MET: metformin; PDA: polydopamine; PME: PDA@MET@ECN.
Additional Figure 3.
Additional Figure 3.. The appearance of CT26 tumours. ECN: Escherichia coli Nissle 1917; MET: metformin; PBS: phosphate buffered saline; PDA: polydopamine; PE: PDA@ECN; PM: PDA@MET; PME: PDA@MET@ECN.
Additional Figure 4.
Additional Figure 4.. Body weight during the different treatments. ECN: Escherichia coli Nissle 1917; MET: metformin; PBS: phosphate buffered saline; PDA: polydopamine; PE: PDA@ECN; PM: PDA@MET; PME: PDA@MET@ECN.

Similar articles

References

    1. Li X., Yong T., Wei Z., Bie N., Zhang X., Zhan G., Li J., Qin J., Yu J., Zhang B., Gan L., Yang X. Reversing insufficient photothermal therapy-induced tumor relapse and metastasis by regulating cancer-associated fibroblasts. Nat Commun. 2022;13:2794. - PMC - PubMed
    1. Ji B., Wei M., Yang B. Recent advances in nanomedicines for photodynamic therapy (PDT)-driven cancer immunotherapy. Theranostics. 2022;12:434–458. - PMC - PubMed
    1. Overchuk M., Weersink R. A., Wilson B. C., Zheng G. Photodynamic and photothermal therapies:synergy opportunities for nanomedicine. ACS Nano. 2023;17:7979–8003. - PMC - PubMed
    1. Jiang N., Zhou Z., Xiong W., Chen J., Shen J., Li R., Ye R. Tumor microenvironment triggered local oxygen generation and photosensitizer release from manganese dioxide mineralized albumin-ICG nanocomplex to amplify photodynamic immunotherapy efficacy. Chin Chem Lett. 2021;32:3948–3953.
    1. Peng D., Fu M., Wang M., Wei Y., Wei X. Targeting TGF-βsignal transduction for fibrosis and cancer therapy. Mol Cancer. 2022;21:104. - PMC - PubMed

LinkOut - more resources