. 2025 Apr 17:16:1571786.
doi: 10.3389/fphar.2025.1571786. eCollection 2025.

Targeting PCNA/PARP1 axis inhibits the malignant progression of hepatocellular carcinoma

Affiliations

Targeting PCNA/PARP1 axis inhibits the malignant progression of hepatocellular carcinoma

Jipin Li et al. Front Pharmacol. .

Abstract

Introduction: Proliferating cell nuclear antigen (PCNA) is associated with the proliferation and recurrence of various cancers, and its high expression is associated with poor prognosis in hepatocellular carcinoma (HCC) patients. However, the mechanistic role of PCNA in HCC progression remains poorly understood. This study aimed to investigate how PCNA regulates DNA damage repair and cell cycle progression in HCC, with a focus on its interaction with poly (ADP-ribose) polymerase 1 (PARP1) and therapeutic implications.

Methods: PCNA was targeted genetically and pharmacologically in HCC cells to assess its effects on DNA damage repair and cell cycle arrest. Protein-protein interactions between PCNA and PARP1 were validated through co-immunoprecipitation and functional assays. The sensitivity of HCC cells to the PARP1 inhibitor Olaparib was evaluated under PCNA inhibition. Synergistic effects of AOH1160 (a PCNA inhibitor) and Olaparib were tested in vitro and in vivo using proliferation assays, DNA damage quantification, and cell cycle analysis. Prognostic relevance of PCNA expression was analyzed using TCGA datasets.

Results: Targeting PCNA suppressed DNA damage repair and induced cell cycle arrest in HCC cells. Mechanistically, PARP1 was identified as a downstream target of PCNA and directly interacted with PCNA. Inhibiting the expression or activity of PCNA increased the sensitivity of HCC cells to the PARP1 inhibitor, Olaparib. In addition, AOH1160 and Olaparib synergistically inhibited the proliferation, DNA damage repair and cell cycle progression of HCC cells. Elevated PCNA levels correlated with unfavorable HCC prognosis, supporting its role as a therapeutic biomarker. In vivo experiments also confirmed that repression of the PCNA/PARP1 axis significantly reduced HCC tumor growth.

Discussion: This study elucidates the relationship between PCNA and PARP1 in regulating the malignant progression of HCC, and highlight the pivotal role of PCNA/PARP1 axis in DNA damage repair and cell cycle progression. The correlation between elevated PCNA levels and unfavorable prognosis underscores its potential as a therapeutic biomarker. Repression of PCNA/PARP1 axis significantly inhibits the malignant proliferation of HCC cells both in vitro and in vivo. Collectively, the study provides a mechanistic foundation for therapies targeting PCNA/PARP1 axis.

Keywords: DNA damage repair; PARP1; PCNA; cell cycle progression; hepatocellular carcinoma.


Conflict of interest statement

The authors declare that the research was conducted in the absence of any commercial or financial relationships that could be construed as a potential conflict of interest.

Figures
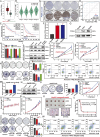
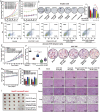
FIGURE 1
FIGURE 1
PCNA promotes the malignant proliferation of HCC cells. The differential expression of PCNA between HCC tissues and adjacent tissues obtained from TCGA dataset (A, B) and the HPA databases (C). (D) Diagnostic ROC for PCNA in HCC and normal samples. (E) The impact of PCNA mRNA expression on patient survival was analyzed by Kaplan-Meier survival curve. The expression levels of PCNA in HCC cell lines were detected via Q-PCR (F) and Western blotting (G). HepG2 cells and Huh7 cells were transfected by shNC, shPCNA, shPCNA and oePCNA, the transfected efficiency was verified by Q-PCR (H) and Western blotting (I). The viability and colongenic growth of HepG2 cells and Huh7 cells with or without PCNA knockdown was analyzed using MTT assay (J) and colony formation assay, followed by quantification of colony numbers. (K). (L) Apoptosis of HepG2 cells with or without PCNA knockdown was assessed via flow cytometry with 7-AAD and annexin V-PE double staining. Hep3B cells was transfected by oeNC and oePCNA, the transfected efficiency was verified by Q-PCR (M) and Western blotting (N). The viability and colongenic growth of Hep3B cells with or without PCNA overexpression was analyzed using colony formation assay, followed by quantification of colony numbers. (O) and MTT assay (P). (Q–S) HepG2 cells were subcutaneously implanted into nude mice after shNC or shPCNA transfection. Mice weight (Q) and tumor volume (R) were measured. The picture shows the size of the tumor (S). (T) Immunohistochemical staining of Ki67 in the isolated xenograft tumor. (U) The IC50 of AOH1160, PCNA inhibitor, in HepG2 and Huh7 cells. (V) Colony formation of HepG2 cells and Huh7 cells treated with different concentrations of AOH1160, followed by quantification of colony numbers. (W) Apoptosis of HepG2 cells treated with different concentrations of AOH1160. The results from three independent experiments were statistically analyzed using one-way ANOVA: *P < 0.05, **P < 0.01.
FIGURE 2
FIGURE 2
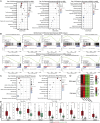
PCNA regulates genes involved in DNA repair and cell cycle progression. (A) Top 15 biological pathways of these downregulated genes after PCNA knockdown in HepG2 cells were analyzed by GO enrichment, KEGG pathway enrichment, and Reactome enrichment. (B) GSEA plots of the downregulated gene signature resulting from the knockdown of PCNA in HepG2 cells. (C) GO enrichment and KEGG pathway enrichment analysis of PCNA PPI network. (D) Heatmap plot of the key DEGs induced by PCNA knockdown. (E) The differential expression of the key DEGs in HCC of the TCGA project.
FIGURE 3
FIGURE 3
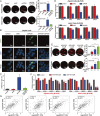
Repression of PCNA inhibits DNA repair in HCC cells. (A) The alkaline comet assay was performed to evaluate DNA damage in PCNA-knockdown HepG2 and Huh7 cells, with DNA damage levels quantified by measuring the percentage of tail DNA. (B) The foci of γH2AX were measured via immunofluorescence to evaluate the DNA double-strand break of HepG2 cells after PCNA knockdown. Magnification is ×100, scale bar = 10 μm. (C) Quantification of the number of γ-H2AX-positive foci in each cell based on immunofluorescence in HepG2 cells. (D) The Relative mRNA levels of indicated regulators of DNA repair following PCNA knockdown in HepG2 cells and Huh7 cells. (E) The effects of AOH1160 on DNA damage were assessed using the alkaline comet assay, with results quantified by measuring the percentage of tail DNA. (F) The effects of AOH1160 on the expression of DNA repair-related genes were analyzed by Q-PCR. (G) Expression correlation analysis of PCNA and key factors involved in DNA damage repair using the data from TCGA project. The results from three independent experiments were statistically analyzed using one-way ANOVA: *P < 0.05, **P < 0.01 compared with the control.
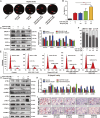
FIGURE 4
FIGURE 4
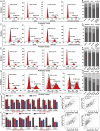
Inhibition of PCNA arrests cell cycle progression in HCC cells. (A–D) Cell cycle analysis was performed by flow cytometry in HepG2 cells and Huh7 cells with or without PCNA knockdown. (E–H) Cell cycle analysis was performed by flow cytometry in HepG2 cells and Huh7 cells treated with AOH1160. (I) Relative mRNA levels of indicated regulators of cell cycle progression following PCNA knockdown in HepG2 cells and Huh7 cells. (J) The effects of AOH1160 on the expression of genes involved in the cell cycle were analyzed by Q-PCR. (K) Expression correlation analysis of PCNA and the genes involved in cell cycle progression using the data from TCGA project. The results from three independent experiments were statistically analyzed using one-way ANOVA: *P < 0.05, **P < 0.01 compared with the control.
FIGURE 5
FIGURE 5
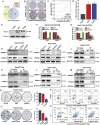
PCNA directly interacted with PARP1 to promote HCC proliferation. (A) Venn diagram for downregulated gene signature resulting from knockdown of PCNA and the PCNA PPI network. (B) Representative IHC staining intensity of PARP1 in HCC and normal tissues from the HPA databases. (C) ROC curves of PARP1 for HCC prediction in TCGA. The expression of PARP1 among different HCC cell lines was detected by Q-PCR (D) and Western blotting (E). The expression of PCNA and PARP1 in HepG2 cells and Huh7 cells transduced with shPCNA or shPARP1 was analyzed by Q-PCR (F, G) and Western blotting (H, I). (J–M) The relationship between PCNA and PARP1 was analyzed by Co-IP assay. Colony formation assays were performed to analyze proliferation in PARP1-knockdown (N) and Olaparib-treated (O) HepG2 cells, followed by quantification of colony numbers. Apoptosis of HepG2 cells with PARP1 knockdown (P) or Olaparib (Q) was assessed by flow cytometry. The results from three independent experiments were statistically analyzed using one-way ANOVA: *P < 0.05, **P < 0.01.
FIGURE 6
FIGURE 6
Knockdown of PCNA increases the sensitivity of HCC cells to PARP1 inhibitor Olaparib. HepG2 cells were transfected with shNC or shPCNA and followed by Olaparib (10 μM) treatment for 6 days. (A, B) Proliferation was detected by colony formation assay, followed by quantification of colony numbers. (C, D) DNA damage level was assessed by alkaline comet assay, followed by quantification of the percentage of tail DNA. (E) Apoptosis was assessed by flow cytometry with PI and annexin V-FITC double staining. (F) Cell cycle analyses were conducted by flow cytometry. (G) Relative expression of DNA repair-related genes and factors involved in cell cycle progression were analyzed by Q-PCR. (H, I) The protein expression levels of DNA repair-related factors following each individual treatment were analyzed via Western blotting. (J, K) The protein expression levels of factors involved in cell cycle progression were analyzed by Western blotting. The effects of shPCNA, Olaparib, and their combination on mice weight (L), tumor volume (M), and tumor weight (N). The photos of tumor nodules (O) in each group. (P) Immunohistochemical staining of PCNA and PARP1 in the isolated xenograft tumor. The results from three independent experiments were statistically analyzed using one-way ANOVA: *P < 0.05, **P < 0.01 compared with the shNC group; #P < 0.05, ##P < 0.01 compared with the shPCNA/Olaparib combined group (Olaparib: 40 mg/kg).
FIGURE 7
FIGURE 7
Combined inhibition of PCNA and PARP1 has a synergistic effect on HCC cells. (A) The effects of combining AOH1160 and Olaparib on the proliferation of HepG2 cells. (B) CI values for concurrent treatment with AOH1160 and Olaparib in HepG2 cells. (C) The effects of AOH1160 and/or Olaparib on the proliferation of HepG2 cells were measured by colony formation assay, followed by quantification of colony numbers. (D) The effects of AOH1160 and/or Olaparib on the apoptosis of HepG2 cells. (E–I) HepG2 cells were injected into nude mice and the mice were subsequently treated with AOH1160 and/or Olaparib at the indicated times. The tumor volume (E), tumor weight (F), mice weight (G), relative volume and weight inhibition (H), and tumor nodules (I) in each group. (J) Immunohistochemical staining of Ki67 in the isolated xenograft tumor. (K) Tissue damage was determined by H&E staining. The results from three independent experiments were statistically analyzed using one-way ANOVA: *P < 0.05, **P < 0.01 compared with the control; #P < 0.05, ##P < 0.01 compared with the AOH1160/Olaparib combined group (AOH1160/Olaparib: 10 + 20 mg/kg).
FIGURE 8
FIGURE 8
AOH1160 and Olaparib synergistically inhibit DNA damage repair and cell cycle progression. (A) The effects of AOH1160 and/or Olaparib on DNA damage detected by alkaline comet assay. (B) Quantified results by the percentage of tail DNA in the comet assay. (C, D) The effects of AOH1160 and/or Olaparib on the expression of DNA repair-related proteins were analyzed by Western blotting in HepG2 cells. (E, F) The effects of AOH1160 and/or Olaparib on cell cycle progression in HepG2 cells. (G, H) The effects of AOH1160 and/or Olaparib on the expression of proteins involved in cell cycle control were analyzed by Western blotting in HepG2 cells. (I) Effects of AOH1160 and/or Olaparib on the expression of PCNA and PARP1 in vivo analyzed by immunohistochemistry.

Similar articles

References

    1. Arbel M., Choudhary K., Tfilin O., Kupiec M. (2021). PCNA loaders and unloaders-one ring that rules them all. Genes (Basel) 12 (11), 1812. 10.3390/genes12111812 - DOI - PMC - PubMed
    1. Becht R., Kiełbowski K., Wasilewicz M. P. (2024). New opportunities in the systemic treatment of hepatocellular carcinoma-today and tomorrow. Int. J. Mol. Sci. 25 (3), 1456. 10.3390/ijms25031456 - DOI - PMC - PubMed
    1. Boehm E. M., Gildenberg M. S., Washington M. T. (2016). The many roles of PCNA in eukaryotic DNA replication. Enzymes 39, 231–254. 10.1016/bs.enz.2016.03.003 - DOI - PMC - PubMed
    1. Bournaka S., Badra-Fajardo N., Arbi M., Taraviras S., Lygerou Z. (2024). The cell cycle revisited: DNA replication past S phase preserves genome integrity. Semin. Cancer Biol. 99, 45–55. 10.1016/j.semcancer.2024.02.002 - DOI - PubMed
    1. Brown Z. J., Tsilimigras D. I., Ruff S. M., Mohseni A., Kamel I. R., Cloyd J. M., et al. (2023). Management of hepatocellular carcinoma: a review. JAMA Surg. 158 (4), 410–420. 10.1001/jamasurg.2022.7989 - DOI - PubMed

LinkOut - more resources