[Preprint]. 2025 Apr 25:rs.3.rs-5926885.
doi: 10.21203/rs.3.rs-5926885/v1.

Harnessing the Power of Single-Cell Large Language Models with Parameter Efficient Fine-Tuning using scPEFT

Affiliations

Harnessing the Power of Single-Cell Large Language Models with Parameter Efficient Fine-Tuning using scPEFT

Fei He et al. Res Sq. .

Abstract

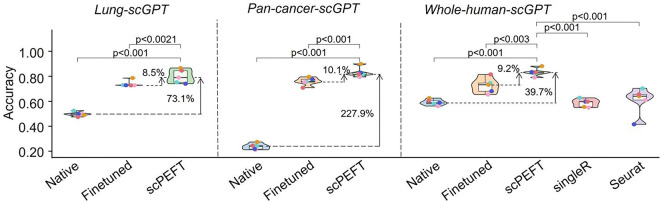
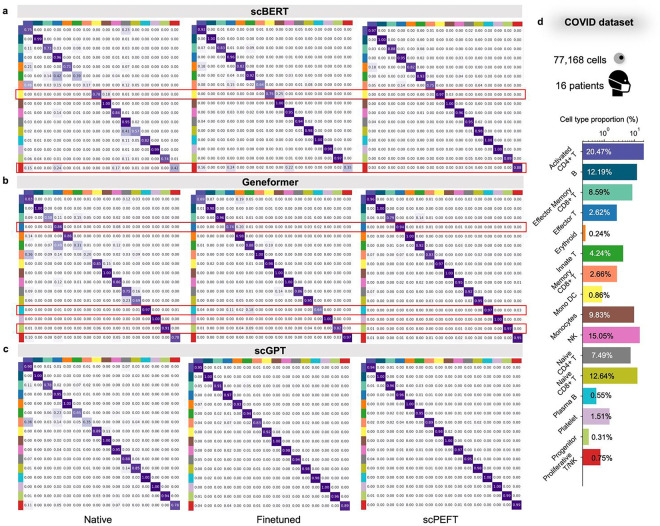
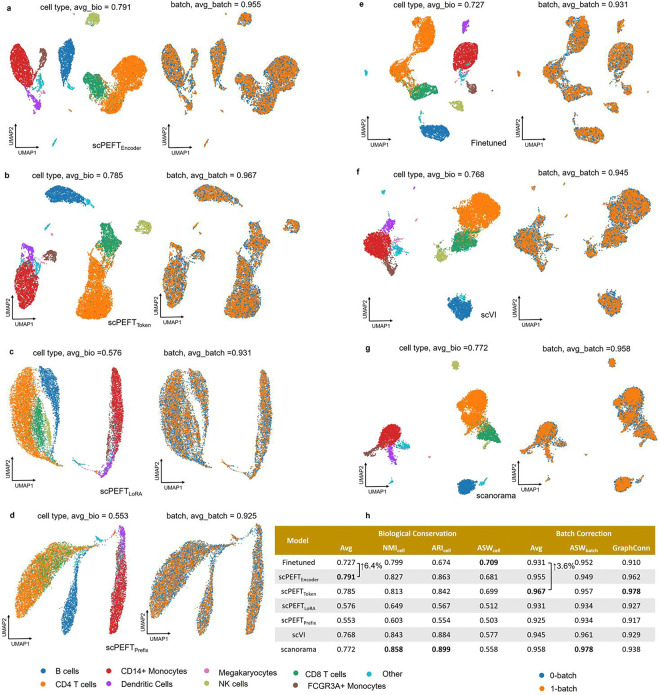
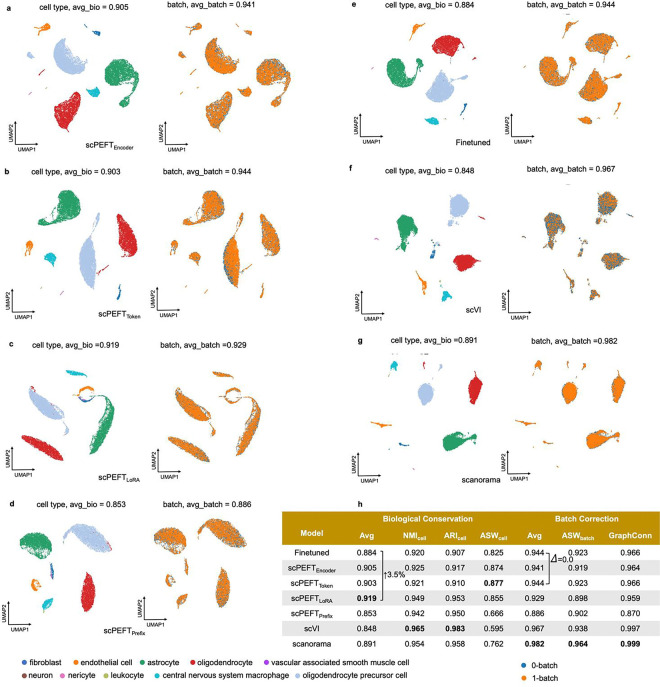
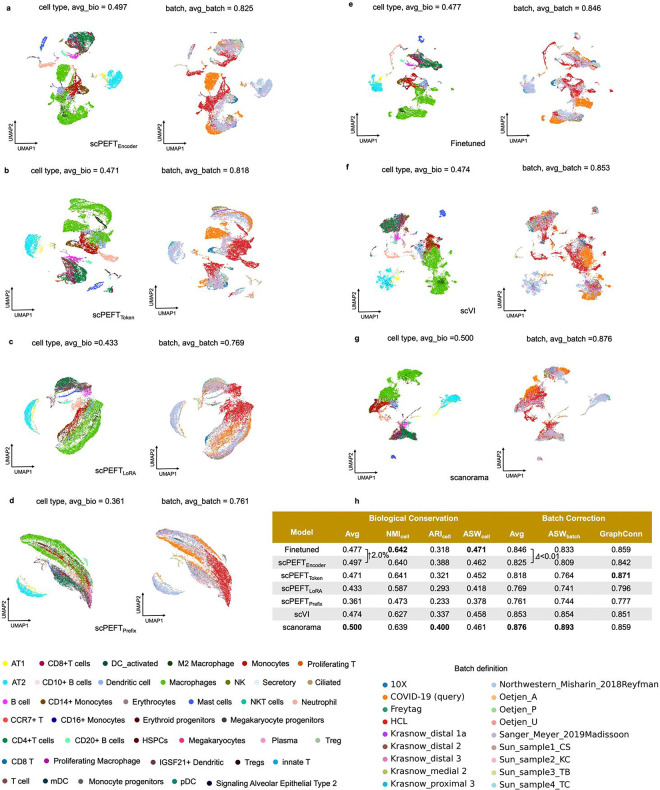
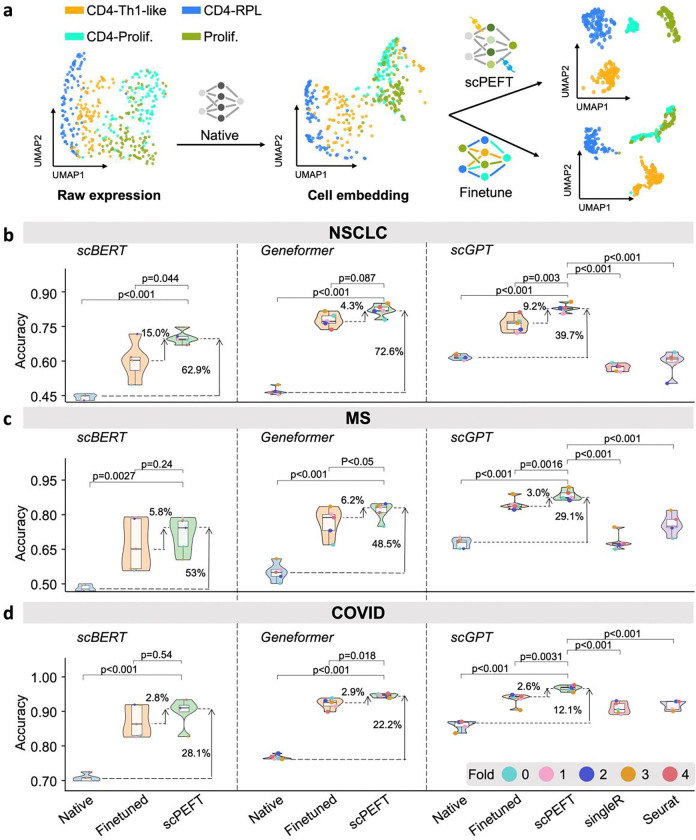
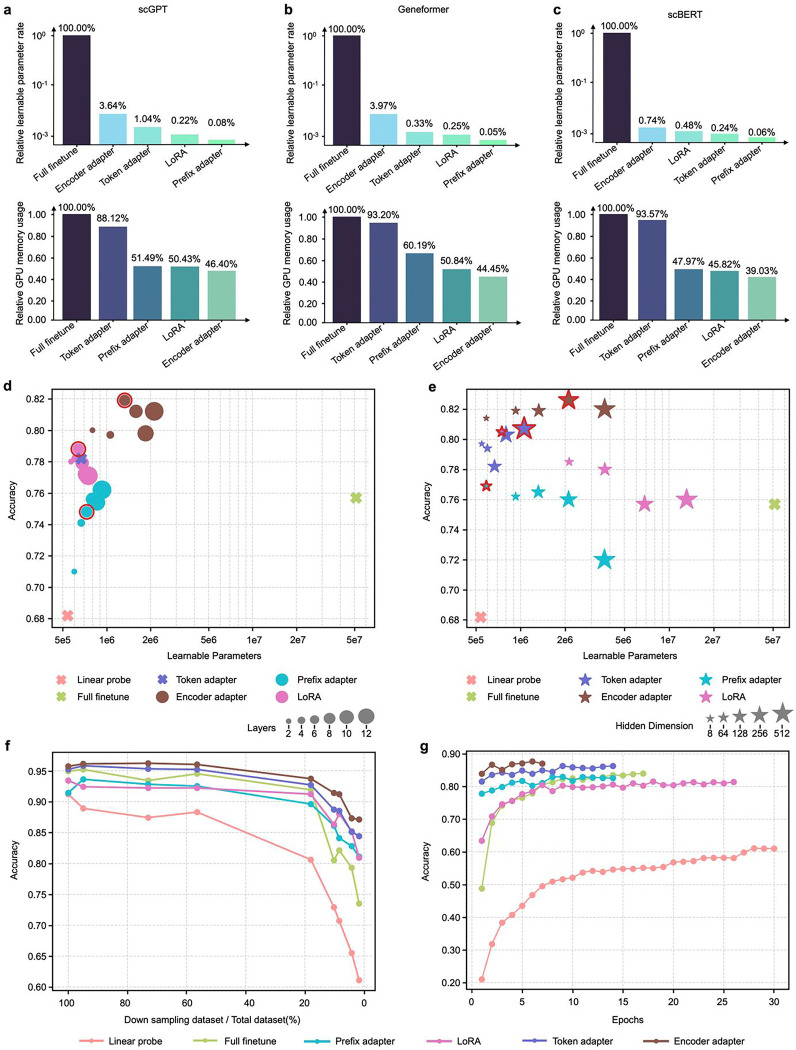
Single-cell large language models (scLLMs) capture essential biological insights from vast single-cell atlases but struggle in out-of-context applications, where zero-shot predictions can be unreliable. To address this, we introduce a single-cell parameter-efficient fine-tuning (scPEFT) framework that integrates learnable, low-dimensional adapters into scLLMs. By freezing the backbone model and updating only the adapter parameters, scPEFT efficiently adapts to specific tasks using limited custom data. This approach mitigates catastrophic forgetting, reduces parameter tuning by over 96%, and decreases GPU memory usage by more than half, significantly enhancing scLLMs's accessibility for resource-constrained researchers. Validated across diverse datasets, scPEFT outperformed zero-shot models and traditional fine-tuning in disease-specific, cross-species, and under-characterized cell population tasks. Its attention-mechanism analysis identified COVID-related genes associated with specific cell states and uncovered unique blood cell subpopulations, demonstrating scPEFT's capacity for condition-specific interpretations. These findings position scPEFT as an efficient solution for improving scLLMs' utilities in general single-cell analyses.


Conflict of interest statement

Competing interests The authors declare no competing interests.

Figures

Extended Data Figure 1:
Extended Data Figure 1:. Violin plots of benchmarking results using different scGPT pre-trained weights on the NSCLC dataset.
The violin plots benchmark native, finetuned scGPT, and scPEFT using scGPT pre-trained weights from whole human data, pan-cancer data, and lung-specific data.
Extended Data Figure 2:
Extended Data Figure 2:. Confusion matrices for benchmarking cell type identification on the NSCLC dataset.
a-c, Confusion matrices for native, fine-tuned scLLMs, and scPEFT with (a) scBERT, (b) Geneformer, and (x) scGPT as respective backbones. Each cell reflects the percentage of instances from the row-defined cell type that are predicted as the column-defined cell type. High values along the diagonal indicate accurate predictions, while off-diagonal values represent misclassifications. The results exhibit the superior performance of scPEFT, particularly in identifying rare cell types (proportion < 5%). Notably, CD4+ enriched proliferation T cells were accurately identified by native scLLMs but misclassified by finetuned models, demonstrating an instance of catastrophic forgetting. This issue was not observed by scPEFT and was marked by the red boxes. d, Bar plot depicting the proportion of each cell type in the dataset.
Extended Data Figure 3:
Extended Data Figure 3:. Confusion matrices for benchmarking cell type identification on the MS dataset.
a-c, Confusion matrices for native, fine-tuned scLLMs, and scPEFT with (a) scBERT, (b) Geneformer, and (c) scGPT as respective backbones. Notably, multiple cell types were accurately identified by native scLLMs but misclassified by their finetuned models, demonstrating clear instances of catastrophic forgetting. This issue was not observed by scPEFT and was marked by the red boxes. d, Bar plot depicting the proportion of each cell type in the dataset.
Extended Data Figure 4:
Extended Data Figure 4:. Confusion matrices for benchmarking cell type identification on the COVID dataset.
a-c, Confusion matrices for native, fine-tuned scLLMs, and scPEFT with (a) scBERT, (b) Geneformer, and (c) scGPT as respective backbones. Notably, the excitatory neuron cells at cortex layer 2–3 were accurately identified by native scGPT but misclassified by its finetuned model, demonstrating an instance of catastrophic forgetting. This issue was not observed by scPEFT and was marked by the red boxes. d, Bar plot depicting the proportion of each cell type in the dataset.
Extended Data Figure 5:
Extended Data Figure 5:. Histograms of differential attention scores for COVID-related cell-state-specific genes.
Histograms of differential attention scores were derived from (a) native, (b) fine-tuned scGPT, and (c) scPEFT models, respectively, in analysis of COVID-related cell-state-specific genes in Memory CD8+ T cells versus Naïve Memory CD8+ T cells. Histograms were generated for the top, middle, and last Transformer layers in these models. Red crosses mark the bins where genes of interest (CCL5, GZMK, and CST7) were located.
Extended Data Figure 6:
Extended Data Figure 6:. Volcano plots of COVID-related cell-state-specific genes.
The COVID-related cell-state-specific genes were analyzed in the comparisons of (a) Memory CD8+ T cells versus Naïve Memory CD8+ T cells, and (b) Effector Memory CD8+ T cells versus Memory CD8+ T cells, respectively. Volcano plots of Differential Gene Expression (DEG) analysis are colored by differential attention scores from native scGPT, finetuned scGPT, and scPEFT trained on the COVID dataset. The top attention genes of interest were highlighted with their names. Dot size reflects the genes’ adjusted p-values from DEG.
Extended Data Figure 7:
Extended Data Figure 7:. Batch correction results on the PBMC 10K dataset.
a-g, UMAP visualizations of corrected cell embeddings, color-coded by cell type and batch, for scPEFT (using Encoder adapter, Token adapter, LoRA, and Prefix adapter), fine-tuned scGPT, scVI, and Scanorama. h, Comparative table of batch correction performance across these methods.
Extended Data Figure 8:
Extended Data Figure 8:. Batch correction results on the Perirhinal cortex dataset.
a-g, UMAP visualizations of corrected cell embeddings, color-coded by cell type and batch, for scPEFT (using Encoder adapter, Token adapter, LoRA, and Prefix adapter), fine-tuned scGPT, scVI, and Scanorama. h, Comparative table of batch correction performance across these methods.
Extended Data Figure 9:
Extended Data Figure 9:. Batch correction results on the COVID-BATCH dataset.
a-g, UMAP visualizations of corrected cell embeddings, color-coded by cell type and batch, for scPEFT (using Encoder adapter, Token adapter, LoRA, and Prefix adapter), fine-tuned scGPT, scVI, and Scanorama. h, Comparative table of batch correction performance across these methods.
Figure 1:
Figure 1:. Overview of scPEFT.
a, scLLM Architecture. A typical scLLM features a gene tokenizer that encodes gene identities and expression profiles into gene embeddings. This is followed by the Encoder, comprising multiple Transformer blocks that aggregate gene expression in cells into gene and cell representations. The final module, a projector, transforms these gene and cell embeddings into task-specific outputs. With the adapters from scPEFT, it can be adapted to various out-of-context applications without updating its original parameters, through task-specific objective functions and back-propagation. b, Adapters in scPEFT. Four types of adapters enhance scLLM’s domain adaptability: (i) Token Adapter, a compact autoencoder integrated into the gene tokenizer, refines gene token embeddings for specific tasks in reduced dimensional space. (ii) Prefix Adapter, which appends tunable tokens to gene tokens to incorporate task-specific information. (iii) RoLA (Rank-ordered Low-rank Approximation), which introduces low-rank matrices A and B into the Transformers to approximate model adjustments for the target domain. (iv) Encoder Adapter, another autoencoder attached to a Transformer block, customizes gene contextual embeddings to new biological contexts. These adapters can be used in combination. c, Downstream applications: scPEFT tailors scLLMs for a range of downstream applications in specific biological contexts, including domain-agnostic cell-type identification, condition-specific gene significance, context-aware cell group characterization, cross-species transfer, perturbation prediction, and so on.
Figure 2:
Figure 2:. Cell type identification results of scPEFT under disease conditions.
a, an illustration of how native scGPT, finetuned scGPT, and scPEFT models drive cell embeddings in their feature space. The data points represent a 10% random sample of cells from four annotated cell types in the query partition of the NSCLC dataset. Native scGPT appears to cluster cells according to their identities but misinterprets some CD4-Th1-like cells into CD4-proliferative cells, likely due to expression shifts in the tumor microenvironment compared to its training data of normal cells. Finetuned scGPT achieves better separation of CD4-Th1-like and CD4-RPL cells but performs worse in distinguishing CD4-proliferative cells from proliferation cells than the native scGPT, indicating catastrophic forgetting of pretrained knowledge. In contrast, scPEFT preserves the capability of native scGPT while benefiting from domain adaptation. b-d, Violin plots benchmarking native, finetuned, and scPEFT models using scBERT, Geneformer, and scGPT as backbones, along with SingleR and Seurat, under five-fold cross-validation on the NSCLC, MS and COVID datasets, respectively. Statistical significance between scPEFT and other models was assessed using a paired Student’s t-test across the five-fold validation results.
Figure 3:
Figure 3:. Efficiency analysis of scPEFT and related scLLMs.
a-c, percentage of learnable parameters and GPU memory usage for fine-tuned scGPT, Geneformer, and scBERT, respectively, relative to scPEFT adapters. Evaluations were conducted using a batch size of 100 cells (the maximum setting for finetuning) on an Nvidia RTX A6000 GPU. GPU memory requirements depend not only on the learnable parameters but also on the gradient propagation path within the model. d, validation accuracies plotted against the number of learnable parameters for varying number of Transformer layers with adapters. Larger dots represent configurations with more layers, hence more parameters. Default scPEFT settings are highlighted. Notably, the highest parameter counts may not yield peak performance, suggesting that overparameterization may misalign with the model’s intrinsic dimensionality, thereby reducing generalization, as reflected in lower validation accuracies. e, Validation accuracies versus learnable parameters for adapters with different hidden representation dimensions. Larger stars indicate higher intermediate embedding dimensions, requiring more tunable parameters. Default scPEFT settings are highlighted. f, validation accuracies of fine-tuned scGPT versus scPEFT adapters using a progressively scaled-down reference dataset. Data points along each curve represent models trained on smaller subsets of the referenced set. g, validation accuracies of training checkpoints for fine-tuned scGPT versus scPEFT adapters. The final point on each curve marks the convergence epoch, defined by no improvement in validation loss over five consecutive epochs or reaching the maximum training limit of 50 epochs.
Figure 4:
Figure 4:. Condition-specific cell-state-associated gene analysis via attention mechanism.
a, workflow for determining gene contributions to specific cell states under given conditions. Attention scores, describing the cell representation cls token’s attention on gene tokens, are extracted and normalized from scLLMs with tuned adapters to assess gene-cell associations. Differential attention scores between control and target cell states are calculated to reveal gene roles in cell-state differentiation under the specified condition. b, validation of differential attention values from native and fine-tuned scGPT, as well as scPEFT, in relation to cell-type-associated signature genes on the NSCLC dataset. The cell-type-associated signature genes were sourced from the original study [18]. A heatmap illustrates differential attention scores derived from native, fine-tuned scGPT, and scPEFT models for each signature gene. Differential attention scores were calculated between the target T cell subtype, defined by the corresponding signature genes, and other T cell subtypes as controls. Statistical significance is denoted by stars on the heatmap, based on corrected p-values obtained using the Wilcoxon rank-sum test and Benjamini-Yekutieli false discovery rate control [57]. Dot plots display the expression profiles of each signature gene across all T cell subtypes. Color bars beneath the signature genes indicate their associated target T cell subtypes, corresponding to the subtype labels on the y-axis. c-e, Histograms of differential attention scores from native, fine-tuned scGPT, and scPEFT models, respectively, in the analysis of COVID-related cell-state-specific genes in Effector Memory CD8+ T cells versus Memory CD8+ T cells. Histograms were generated for the top, middle, and last Transformer layers in these models. Red crosses mark the bins where key effector molecules (KLRB1, GZMA, PRF1) and two effector-function-associated genes (CEBPD and SCART1) were located.
Figure 5:
Figure 5:. Cross-species transfer results of scPEFT.
a, Schematic workflow for adapting the human-pretrained scGPT model to data from other species, including mice, macaque, and C. elegans. During adaptation, non-orthologous genes are masked, and adapters from scPEFT are trained using a small subset of annotated cells from the target species, enabling cross-species cell type contextualization. b, Benchmarking performance of native scGPT, fine-tuned scGPT, and scPEFT across five-fold cross-validation on a mice dataset, alongside comparisons to established cell-type identification tools SingleR and Seurat. Violin plots display performance metrics, with paired Student’s t-tests evaluating the statistical significance of differences between scPEFT and other methods across cross-validation results. c, Confusion matrices illustrate the alignment between annotated and predicted cell types for native scGPT, fine-tuned scGPT, and scPEFT on the mice dataset. d,e, Zero-shot benchmarking violin plots for native, finetune, and scPEFT under five-fold cross-validation on intra-assay and inter-assay interdependent test, respectively, revealing greater stability of scPEFT than finetune strategy in handling assay variance. f,h, Benchmarking violin plots for native, finetune, and scPEFT under five-fold cross-validation on a macaque and C. elegans dataset, respectively. g,i, Confusion matrices for native, finetune, and scPEFT showing the match between annotated and predicted cell types on a macaque and C. elegans dataset, respectively.
Figure 6:
Figure 6:. cPEFT identifies developmental cell populations in BMMC and CD34+ enriched CITE-seq data.
s a, Protein expression patterns for annotated cell identities in BMMC and CD34+ enriched samples, depicted by circle sizes representing the fraction of cells expressing a protein and colors indicating average protein expression levels. b, UMAP visualizations of protein expression profile clusters from BMMC and CD34+ enriched cells. c, UMAP visualizations of cell representations from native, finetuned scGPT, and scPEFT, trained on scRNA-seq data from BMMC and CD34+ enriched cells, excluding cell identity annotations. Arrow points to a BMMC mature B cell subset which clusters closer to pre-proB, and PreB cells, annotated by protein. d, Evaluation of cell representations from native, fine-tuned scGPT, and scPEFT models using the Calinski–Harabasz index. This metric assesses the ability of generative embeddings from each model to effectively characterize protein-annotated cell groups. e, Sankey diagrams illustrating the assignment of cells from protein-annotated identities (left) to clustering results (right), obtained using the Leiden algorithm at a resolution of 1.5. Clustering was performed on embeddings generated by native, fine-tuned scGPT, and scPEFT models. Finetuned scGPT and scPEFT identified more distinct clusters than native scGPT. Notably, scPEFT was able to avoid some perplexing splitting/combining that confounds the interpretation of the finetuned model. For instance, the finetuned model nearly equally split the CD4 Tcm population between a group of memory Treg and exhausted CD4 T cells as well as two groups of Treg and CD4 Tnaive, combined, suggesting some confusion among memory programs. f, Expression profiles of genes receiving high differential attention scores in subgroups #3 vs. #7, #10 vs. #11, and #2 vs. #19 from panel e, with colors representing mean expression within each cluster and dot sizes indicating the fraction of cells expressing a gene. g, Gene Set Enrichment Analysis (GSEA) based on attention differential scores for these subgroups, showcasing Normalized Enrichment Scores with colors denoting the significance of enriched phenotypes.

References

    1. Paik D T, Cho S, Tian L, et al. Single-cell RNA sequencing in cardiovascular development, disease and medicine. Nature Reviews Cardiology, 2020, 17(8): 457–473. - PMC - PubMed
    1. Zhang Y, Zhang Z. The history and advances in cancer immunotherapy: understanding the characteristics of tumor-infiltrating immune cells and their therapeutic implications. Cellular & molecular immunology, 2020, 17(8): 807–821. - PMC - PubMed
    1. Li X, Wang K, Lyu Y, et al. Deep learning enables accurate clustering with batch effect removal in single-cell RNA-seq analysis. Nature communications, 2020, 11(1): 2338. - PMC - PubMed
    1. Yang F, Wang W, Wang F, et al. scBERT as a large-scale pretrained deep language model for cell type annotation of single-cell RNA-seq data. Nature Machine Intelligence, 2022, 4(10): 852–866.
    1. Theodoris C V, Xiao L, Chopra A, et al. Transfer learning enables predictions in network biology. Nature, 2023: 1–9. - PMC - PubMed

Publication types

LinkOut - more resources