. 2025 Apr 17:16:1554222.
doi: 10.3389/fphys.2025.1554222. eCollection 2025.

Effects of high-intensity interval training and moderate-intensity continuous training on mitochondrial dynamics in human skeletal muscle

Affiliations

Effects of high-intensity interval training and moderate-intensity continuous training on mitochondrial dynamics in human skeletal muscle

Yuqing Li et al. Front Physiol. .

Abstract

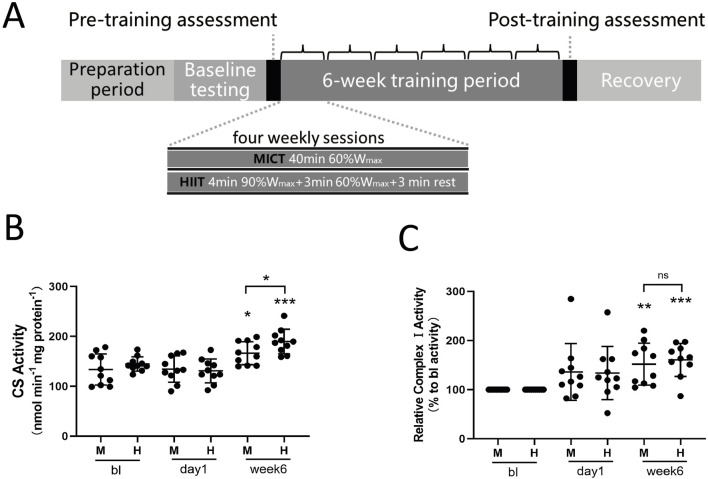
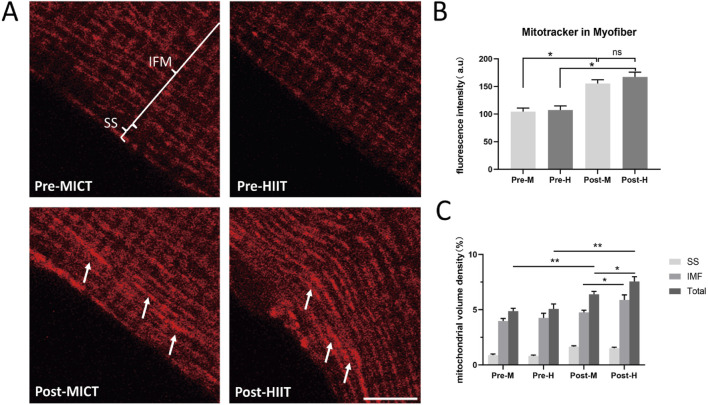
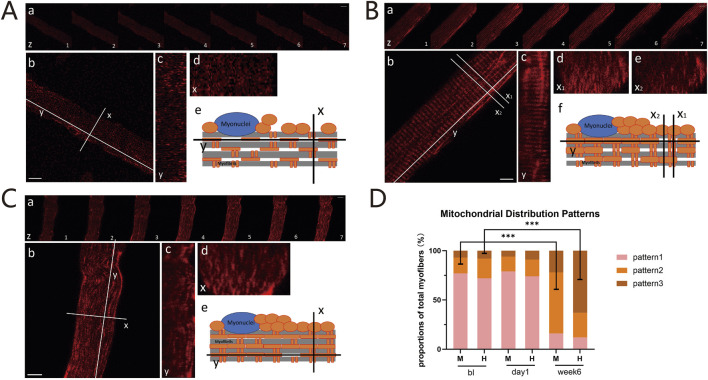
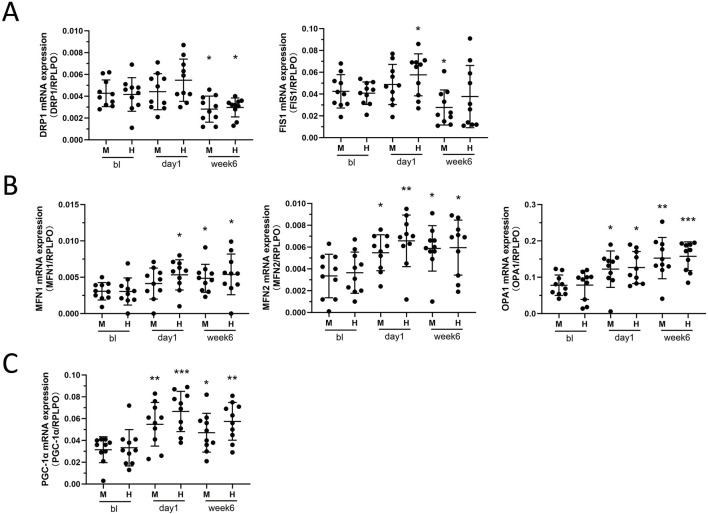
Exercise and physical activity confer health advantages, in part, by enhancing skeletal muscle mitochondrial respiratory function. The objective of this study is to analyze the impacts of high-intensity interval training (HIIT) and moderate-intensity continuous training (MICT) on the dynamics and functionality of the mitochondrial network within skeletal muscle. 20 young male participants were assigned to either HIIT or MICT group. Initial assessments of exercise-related indicators were conducted, followed by skeletal muscle biopsies from the vastus lateralis before, 1 day after, and 6 weeks post-experiment. We utilized multi-dimensional myofiber imaging to analyze mitochondrial morphology and arrangement, and assessed citrate synthase activity, complex I activity, and dynamics-related mRNA. Both training modalities increased VO2max, Wmax, citrate synthase and complex I activities, mitochondrial content, and volume density, though the changes differed between the two groups. 6 weeks training induced remodeling of the mitochondrial network within skeletal muscle. Before training, the network appeared sparse and punctate. After MICT, it adopted a grid-like structure with partially robust longitudinal connections. In contrast, HIIT resulted in a less obvious grid structure but showed a stronger longitudinally oriented network. Training also increased mRNA expression of mitochondrial fusion proteins and decreased fission protein expression, with these effects being more pronounced in HIIT. Similarly, peroxisome proliferator-activated receptor γ coactivator 1-alpha mRNA expression showed a comparable trend, though the changes differed between 1 day and 6 weeks of training. In conclusion, HIIT and MICT induce distinct mitochondrial adaptation in skeletal muscle, reflected in different network remodeling and molecular pathways. These findings may be due to HIIT's more pronounced effect on mitochondrial dynamics or respiratory function, but the study has only conducted preliminary observational experiments and further evidence is required for confirmation.

Keywords: high-intensity interval training; mitochondrial dynamics; mitochondrial network remodeling; moderate-intensity interval training; skeletal muscle.


Conflict of interest statement

The authors declare that the research was conducted in the absence of any commercial or financial relationships that could be construed as a potential conflict of interest.

Figures

FIGURE 1
FIGURE 1
(A) Study Design: The shaded progress bar represents the training phases: preparation period, baseline testing (BL), and 6-week training period. Open bars indicate four sessions of either MICT or HIIT per week. HIIT consisted of four weekly sessions, each lasting 40 min, with four 4-min intervals at 90% of Wmax followed by 3 min at 60% of Wmax, and 3 min of active recovery. MICT consisted of four weekly sessions, each lasting 40 min at 60% of Wmax. (B) Citrate Synthase Activity: Evaluation of citrate synthase (CS) enzyme activity in skeletal muscle mitochondria. (C) Complex I Activity: Evaluation of complex I activity in skeletal muscle mitochondria. Data are presented as the mean ± SD from three independent experiments, each performed in triplicate. Unless otherwise noted, *p < 0.05, **p < 0.01, ***p < 0.001 indicate statistical significance versus the BL group.
FIGURE 2
FIGURE 2
(A) Mitochondrial Fluorescence Images: Mitochondria in isolated myofibers were labeled with MitoTracker Orange. Pre-MICT: Before MICT, the annotations highlight the subsarcolemmal (SS) and intermyofibrillar (IMF); Pre-HIIT: Before HIIT; Post-MICT: After 6-week of MICT; Post-HIIT: After 6-week of HIIT. Scale bar = 10 μm. The white arrows indicate the regions with higher fluorescence intensity. Three independent experiments were conducted; representative images are shown. (B) Fluorescence intensity quantification. Fluorescence intensity of MitoTracker in the same area of isolated myofibers; (C) Volume density quantification. Mitochondrial volume density of SS, IMF, and total mitochondria (Total), as described in the “Materials and methods” section. Data are presented as the mean ± SD from three independent experiments, each performed in triplicate. *p < 0.05, **p < 0.01, ns: not statistically significant.
FIGURE 3
FIGURE 3
(A) Pattern 1: Sparse and Dispersed Punctate Mitochondria Network. (a) Z-axis scans with 1-micron intervals. Scale bar = 10 μm; (b) X-axis (I-bands, transverse) and Y-axis (contraction, longitudinal) of the myofibers. Scale bar = 10 μm; (c) Sagittal plane along the Y-axis; (d) Cross-sectional plane along the X-axis; (e) Schematic of mitochondrial distribution within myofibers. (B) Pattern 2: Grid-like Mitochondria Network with Robust Longitudinal Connections: Panels (a), (b), and (c) are the same as (A). Cross-sections with dense (d) or sparse (e) mitochondria. Schematic diagram (f). (C) Pattern 3: Enhanced Longitudinally-oriented Mitochondria Network: Panels are the same as (A). (D) Proportions of Three Mitochondrial Configurations: Proportions of these mitochondrial distribution patterns between the HIIT and MICT groups at different time points. ***p < 0.001 versus BL group.
FIGURE 4
FIGURE 4
(A) Mitochondrial Fission: DRP1 and Fis1 mRNA expression between HIIT and MICT groups at different time points. (B) Mitochondrial Fusion: MFN1, MFN2, and OPA1 mRNA expression. (C) Mitochondrial Lifecycle Regulator: PGC-1α mRNA expression. Data are presented as mean ± SD of three separate experiments performed in triplicate. *p < 0.05, **p < 0.01, ***p < 0.001 versus BL group.

Similar articles

Cited by

References

    1. Abu Shelbayeh O., Arroum T., Morris S., Busch K. B. (2023). PGC-1α is a master regulator of mitochondrial lifecycle and ROS stress response. Antioxidants (Basel) 12 (5), 1075. 10.3390/antiox12051075 - DOI - PMC - PubMed
    1. Antonicka H., Lin Z. Y., Janer A., Aaltonen M. J., Weraarpachai W., Gingras A. C., et al. (2020). A high-density human mitochondrial proximity interaction network. Cell Metab. 32 (3), 479–497. 10.1016/j.cmet.2020.07.017 - DOI - PubMed
    1. Awad K., Moore L., Huang J., Gomez L., Brotto L., Varanasi V., et al. (2023). Advanced methodology for rapid isolation of single myofibers from flexor digitorum brevis muscle. Tissue Eng. Part C Methods 29 (8), 349–360. 10.1089/ten.TEC.2023.0012 - DOI - PMC - PubMed
    1. Axelrod C. L., Fealy C. E., Mulya A., Kirwan J. P. (2019). Exercise training remodels human skeletal muscle mitochondrial fission and fusion machinery towards a pro-elongation phenotype. Acta Physiol. (Oxf) 225 (4), e13216. 10.1111/apha.13216 - DOI - PMC - PubMed
    1. Bleck C. K. E., Kim Y., Willingham T. B., Glancy B. (2018). Subcellular connectomic analyses of energy networks in striated muscle. Nat. Commun. 9 (1), 5111. 10.1038/s41467-018-07676-y - DOI - PMC - PubMed

LinkOut - more resources