Published Erratum
. 2025 May;14(5):e70081.
doi: 10.1002/jev2.70081.

Correction to "Stress-Induced Rab11a-Exosomes Induce Amphiregulin-Mediated Cetuximab Resistance in Colorectal Cancer"

No authors listed
Published Erratum

Correction to "Stress-Induced Rab11a-Exosomes Induce Amphiregulin-Mediated Cetuximab Resistance in Colorectal Cancer"

No authors listed. J Extracell Vesicles. 2025 May.
No abstract available


Figures

FIGURE 1
FIGURE 1
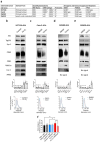
Inhibition of mTORC1 induces secretion of Rab11a‐exosomes in multiple CRC cell lines. (a) Classification of the four CRC cell lines investigated based on molecular pathways and mutational status in critical oncogenes and tumour suppressor genes. (b) Western blot analysis of sEV proteins isolated from HCT116 cells cultured in hypoxic (1% O2) versus normoxic conditions reveals a consistent increase in markers of Rab11a‐exosomes (Rab11a and AREG) and other stress‐induced sEVs (Cav‐1; see histogram, where changes in protein levels, measured by densitometry and normalised to protein levels in secreting cell lysates, are plotted for three independent experiments; mean ± SD). (c–e) Western blots of sEV proteins from Caco‐2 (c), SW480 (d) and SW620 (e) cells treated with the ATP‐competitive mTORC1 inhibitor, Torin1 (100 nM for SW480 cells and 150 nM for Caco‐2 and SW620 cells), versus treatment with vehicle alone (DMSO) also reveals a switch to secretion of increased Rab11a and AREG, in addition to a reduction in CD63. NTA reveals that all sEV preparations have similar size distribution, but particle numbers were generally slightly reduced, ie. SW480: 41.58 ± 0.73 × 10⁸ particles/mL (Torin1) versus 42.58 ± 1.74 × 10⁸ (control) particles/mL: SW620: 13.71 ± 0.47 × 10⁸ particles/mL (Torin1) versus 15.20 ± 0.37 × 10⁸ (control) particles/mL: Caco2: 14.37 ± 0.98 × 10⁸ particles/mL (Torin1) versus 18.11 ± 1.27 × 10⁸ (control) particles/mL. (f) Graph showing levels of HCT116 growth after 120 h, measured as fold change in confluency, following addition of PBS, control HCT116 sEVs, or hypoxia‐induced HCT116 sEVs in the presence or absence of pre‐incubation with neutralising anti‐AREG antibodies. Note that only sEVs isolated under hypoxic conditions enhance growth and this is AREG‐dependent. *P < 0.05. Red and blue asterisks denote reduction and increase in protein levels respectively in Rab11a‐exosome‐enriched sEVs. MSI, microsatellite instability; MSS, microsatellite stability; CMS, consensus molecular subtype; n/a, not applicable. KRAS activating mutations: G13D or G12V. PI3K activating mutations: E545K D549N or H1047R. TP53 inactivating mutations: R273H P309S, or S241F, or E204X. Superscripts 1,2,3 refer to 1Ahmed et al. (2013); 2Sveen et al. (2018); 3Wang et al. (2017).

Erratum for

Publication types

LinkOut - more resources