

Metabolomic analysis reveals key changes in amino acid metabolism in colorectal cancer patients
- PMID: 40314699
- PMCID: PMC12048468
- DOI: 10.1007/s00726-025-03448-3
Metabolomic analysis reveals key changes in amino acid metabolism in colorectal cancer patients
Abstract
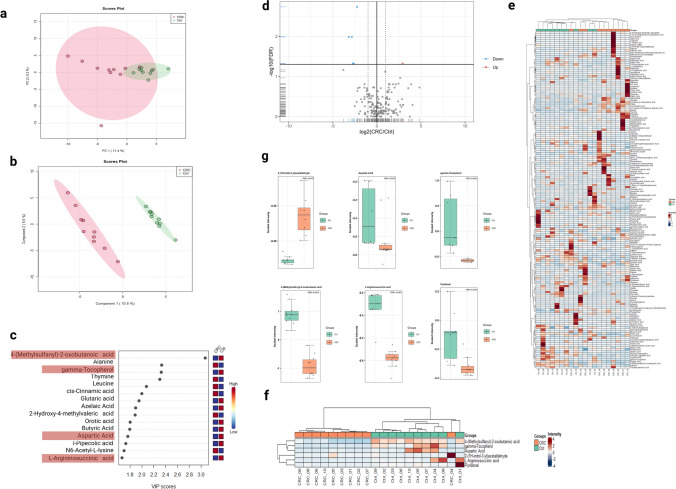
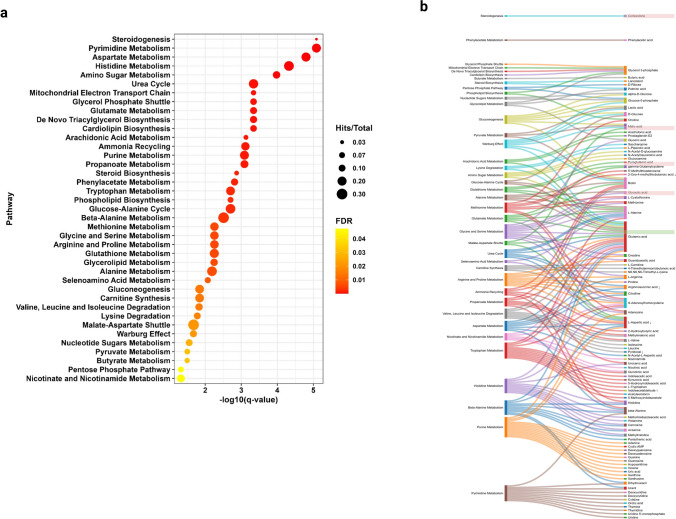
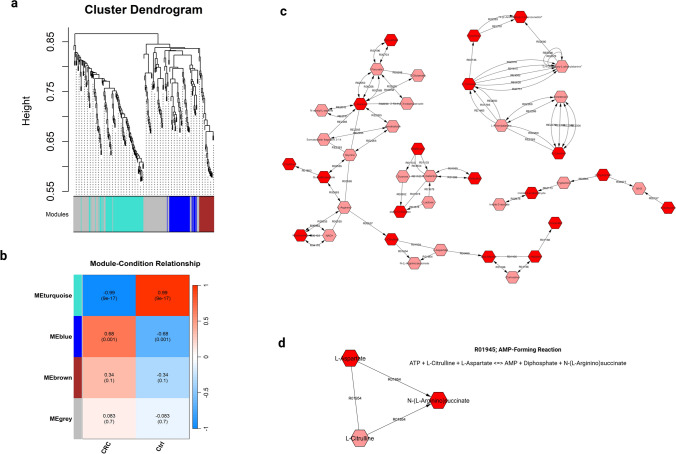
The number of colorectal cancer (CRC) patients is steadily growing worldwide, particularly in developing nations. Nonetheless, recent advances in early detection studies and therapy alternatives have reduced CRC mortality in affluent countries, despite rising incidence. Gut microbiota and their metabolites may contribute to tumor growth and reduced therapeutic efficacy. This preliminary study sought to uncover metabolic fingerprints in colorectal cancer patients. It also emphasizes the correlation between the gut microbiome, microbial metabolism, and altered metabolites in CRC. In this study, stool samples from 20 CRC patients and matched healthy controls were enrolled. Untargeted metabolomics approach based on an ultra-high-performance liquid chromatography high-resolution mass spectrometry (UHPLC-MS/MS) were applied. Statistical approaches, pathway enrichment analysis, and network analysis were employed to unleash CRC perturbed metabolic pathways and putative biomarkers. The study identified a distinct manually curated metabolite profile that is substantially linked to CRC. The steroidogenesis, aspartate, tryptophan (Trp), and urea cycle were the most significant pathways that concurrently contributed to CRC.Prominently, among other pathways, Trp metabolism was identified as a critical pathway, indicating a possible connection between the development of CRC and gut microbiota. In a nutshell the notable resulted metabolites reveal auspicious biomarkers for the initial diagnosis as well as surveilling of CRC progression. This preliminary study highlights the potential involvement that gut bacteria may contribute in CRC patients. Further investigation into the composition of the gut microbiome associated with this metabolic profile may lead to the identification of novel biomarkers for early detection and possible targets for treatment.
Keywords: Colorectal cancer; Gut microbiota; LC–MS; Metabolomics; Microbial tryptophan metabolism.
© 2025. The Author(s).
Conflict of interest statement
Declarations. Conflict of interest: The authors declare no competing interests. Ethical statements: An informed consent was obtained from all subjects in this study. All procedures performed in studies involving human participants were in accordance with the ethical standards of the the Armed Force College of Medicine (AFCM) ethical board (No. 91, 2021), and with the 1964 Helsinki declaration. Informed consent was obtained from all individual participants included in the study.
Figures
References
-
- Banibakhsh A, Sidhu D, Khan S, Haime H, Foster PA (2023) Sex steroid metabolism and action in colon health and disease. J Steroid Biochem Mol Biol 233:106371. 10.1016/j.jsbmb.2023.106371 - PubMed
-
- Bazzaz R, Bijanpour H, Pirouzpanah SMB, Yaghmaei P, Rashtchizadeh N (2019) Adjuvant therapy with gamma-tocopherol-induce apoptosis in HT-29 colon cancer via cyclin-dependent cell cycle arrest mechanism. J Biochem Mol Toxicol 33(11):e22399. 10.1002/jbt.22399 - PubMed
-
- Belcheva A, Irrazabal T, Martin A (2015) Gut microbial metabolism and colon cancer: can manipulations of the microbiota be useful in the management of gastrointestinal health? BioEssays 37(4):403–412. 10.1002/bies.201400204 - PubMed
-
- Bezabeh T, Somorjai R, Dolenko B, Bryskina N, Levin B, Bernstein CN, Jeyarajah E, Steinhart AH, Rubin DT, Smith IC (2009) Detecting colorectal cancer by 1H magnetic resonance spectroscopy of fecal extracts. NMR Biomed 22(6):593–600. 10.1002/nbm.1372 - PubMed
MeSH terms
Substances
Grants and funding
- (AI 42547)/The work presented here is funded by the Armed Force College of Medicine, Cairo, Egypt, and it is partially supported by Science, Technology & Innovation Funding Authority (STDF) under grant (AI 42547).
- (AI 42547)/The work presented here is funded by the Armed Force College of Medicine, Cairo, Egypt, and it is partially supported by Science, Technology & Innovation Funding Authority (STDF) under grant (AI 42547).
LinkOut - more resources
Full Text Sources
Medical
