. 2025 May 6;122(18):e2501269122.
doi: 10.1073/pnas.2501269122. Epub 2025 May 2.

Induced B cell receptor diversity predicts PD-1 blockade immunotherapy response

Affiliations

Induced B cell receptor diversity predicts PD-1 blockade immunotherapy response

Yonglu Che et al. Proc Natl Acad Sci U S A. .

Abstract

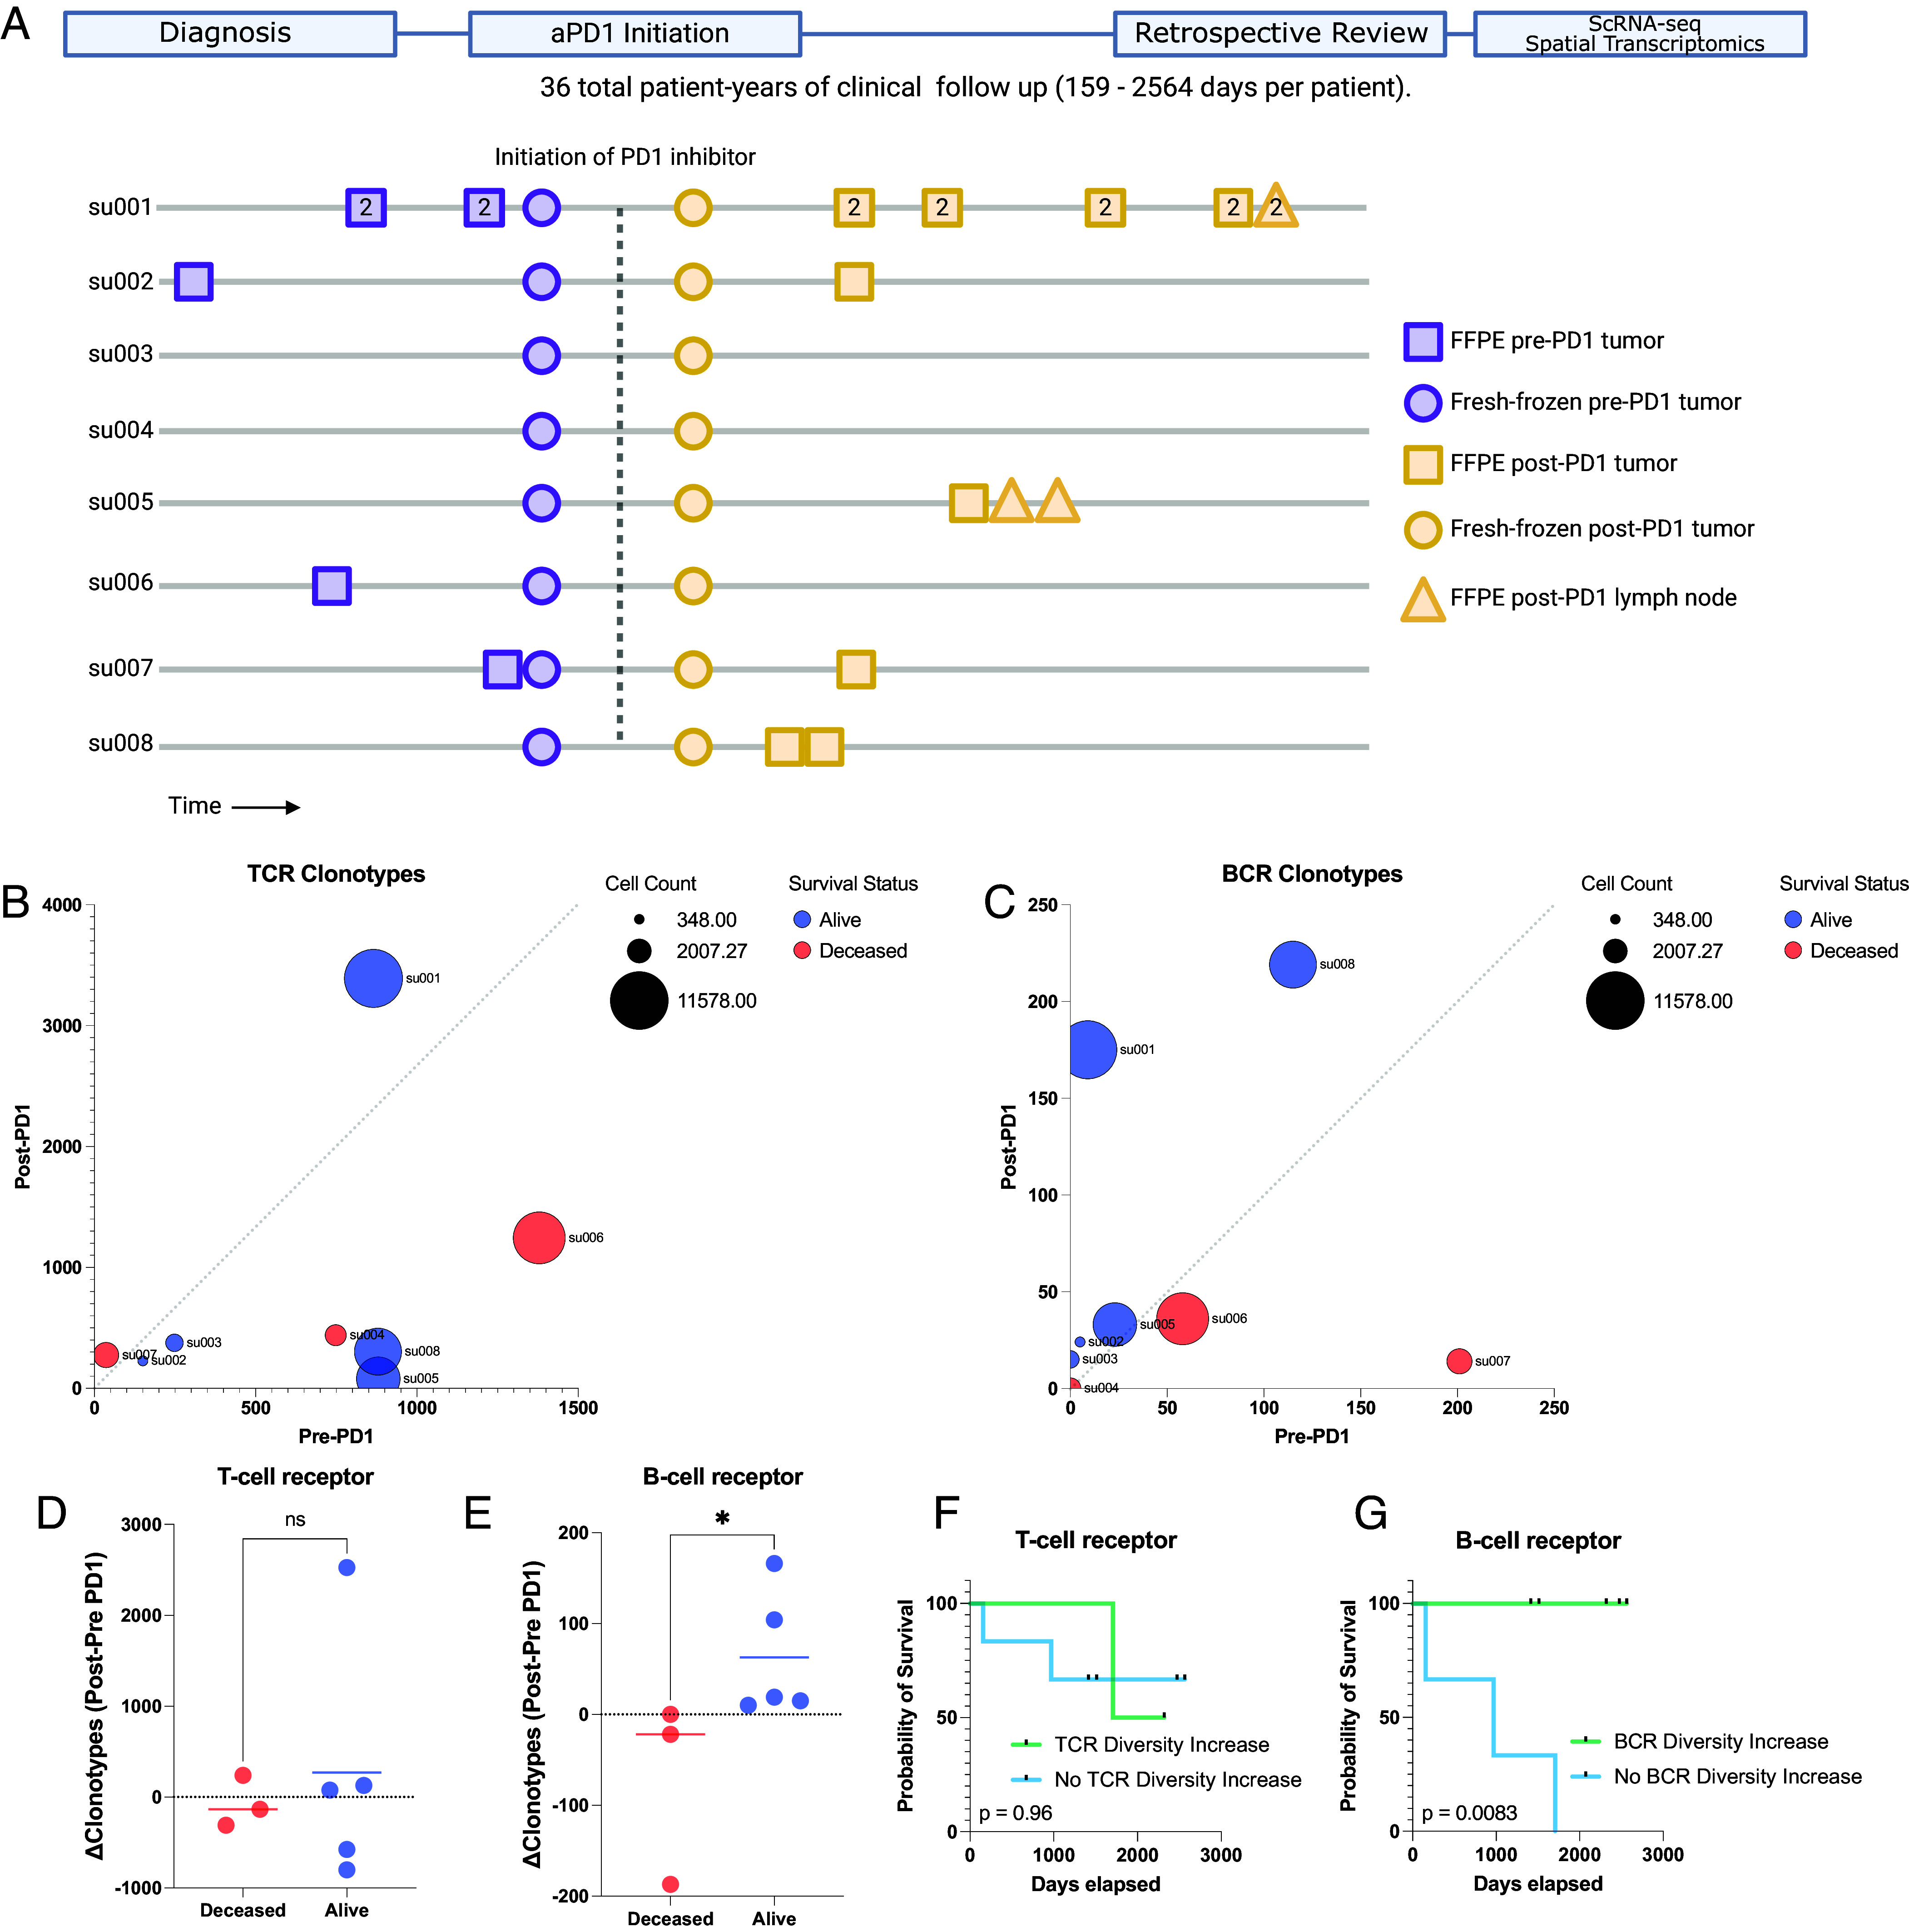
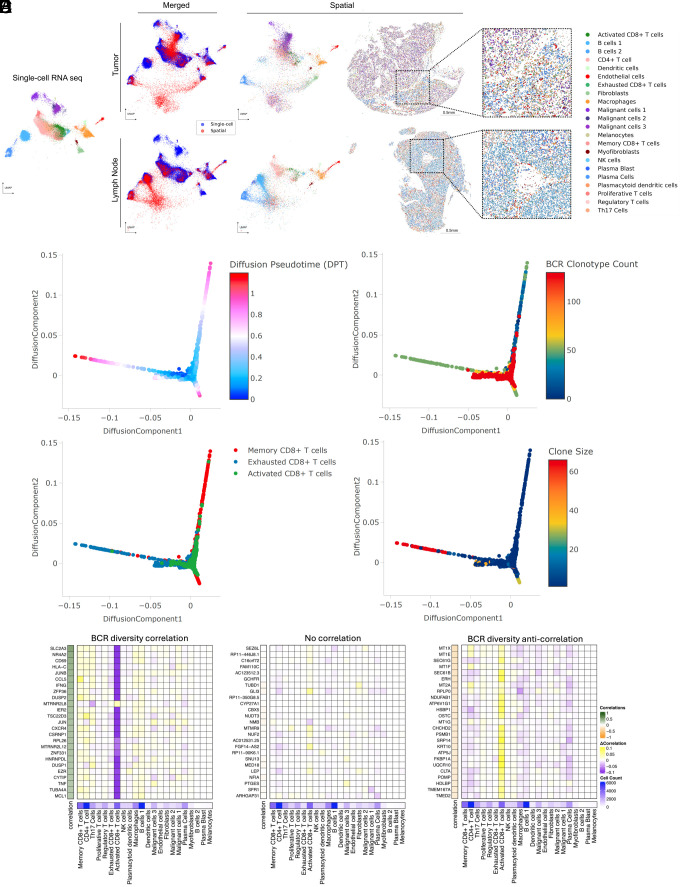
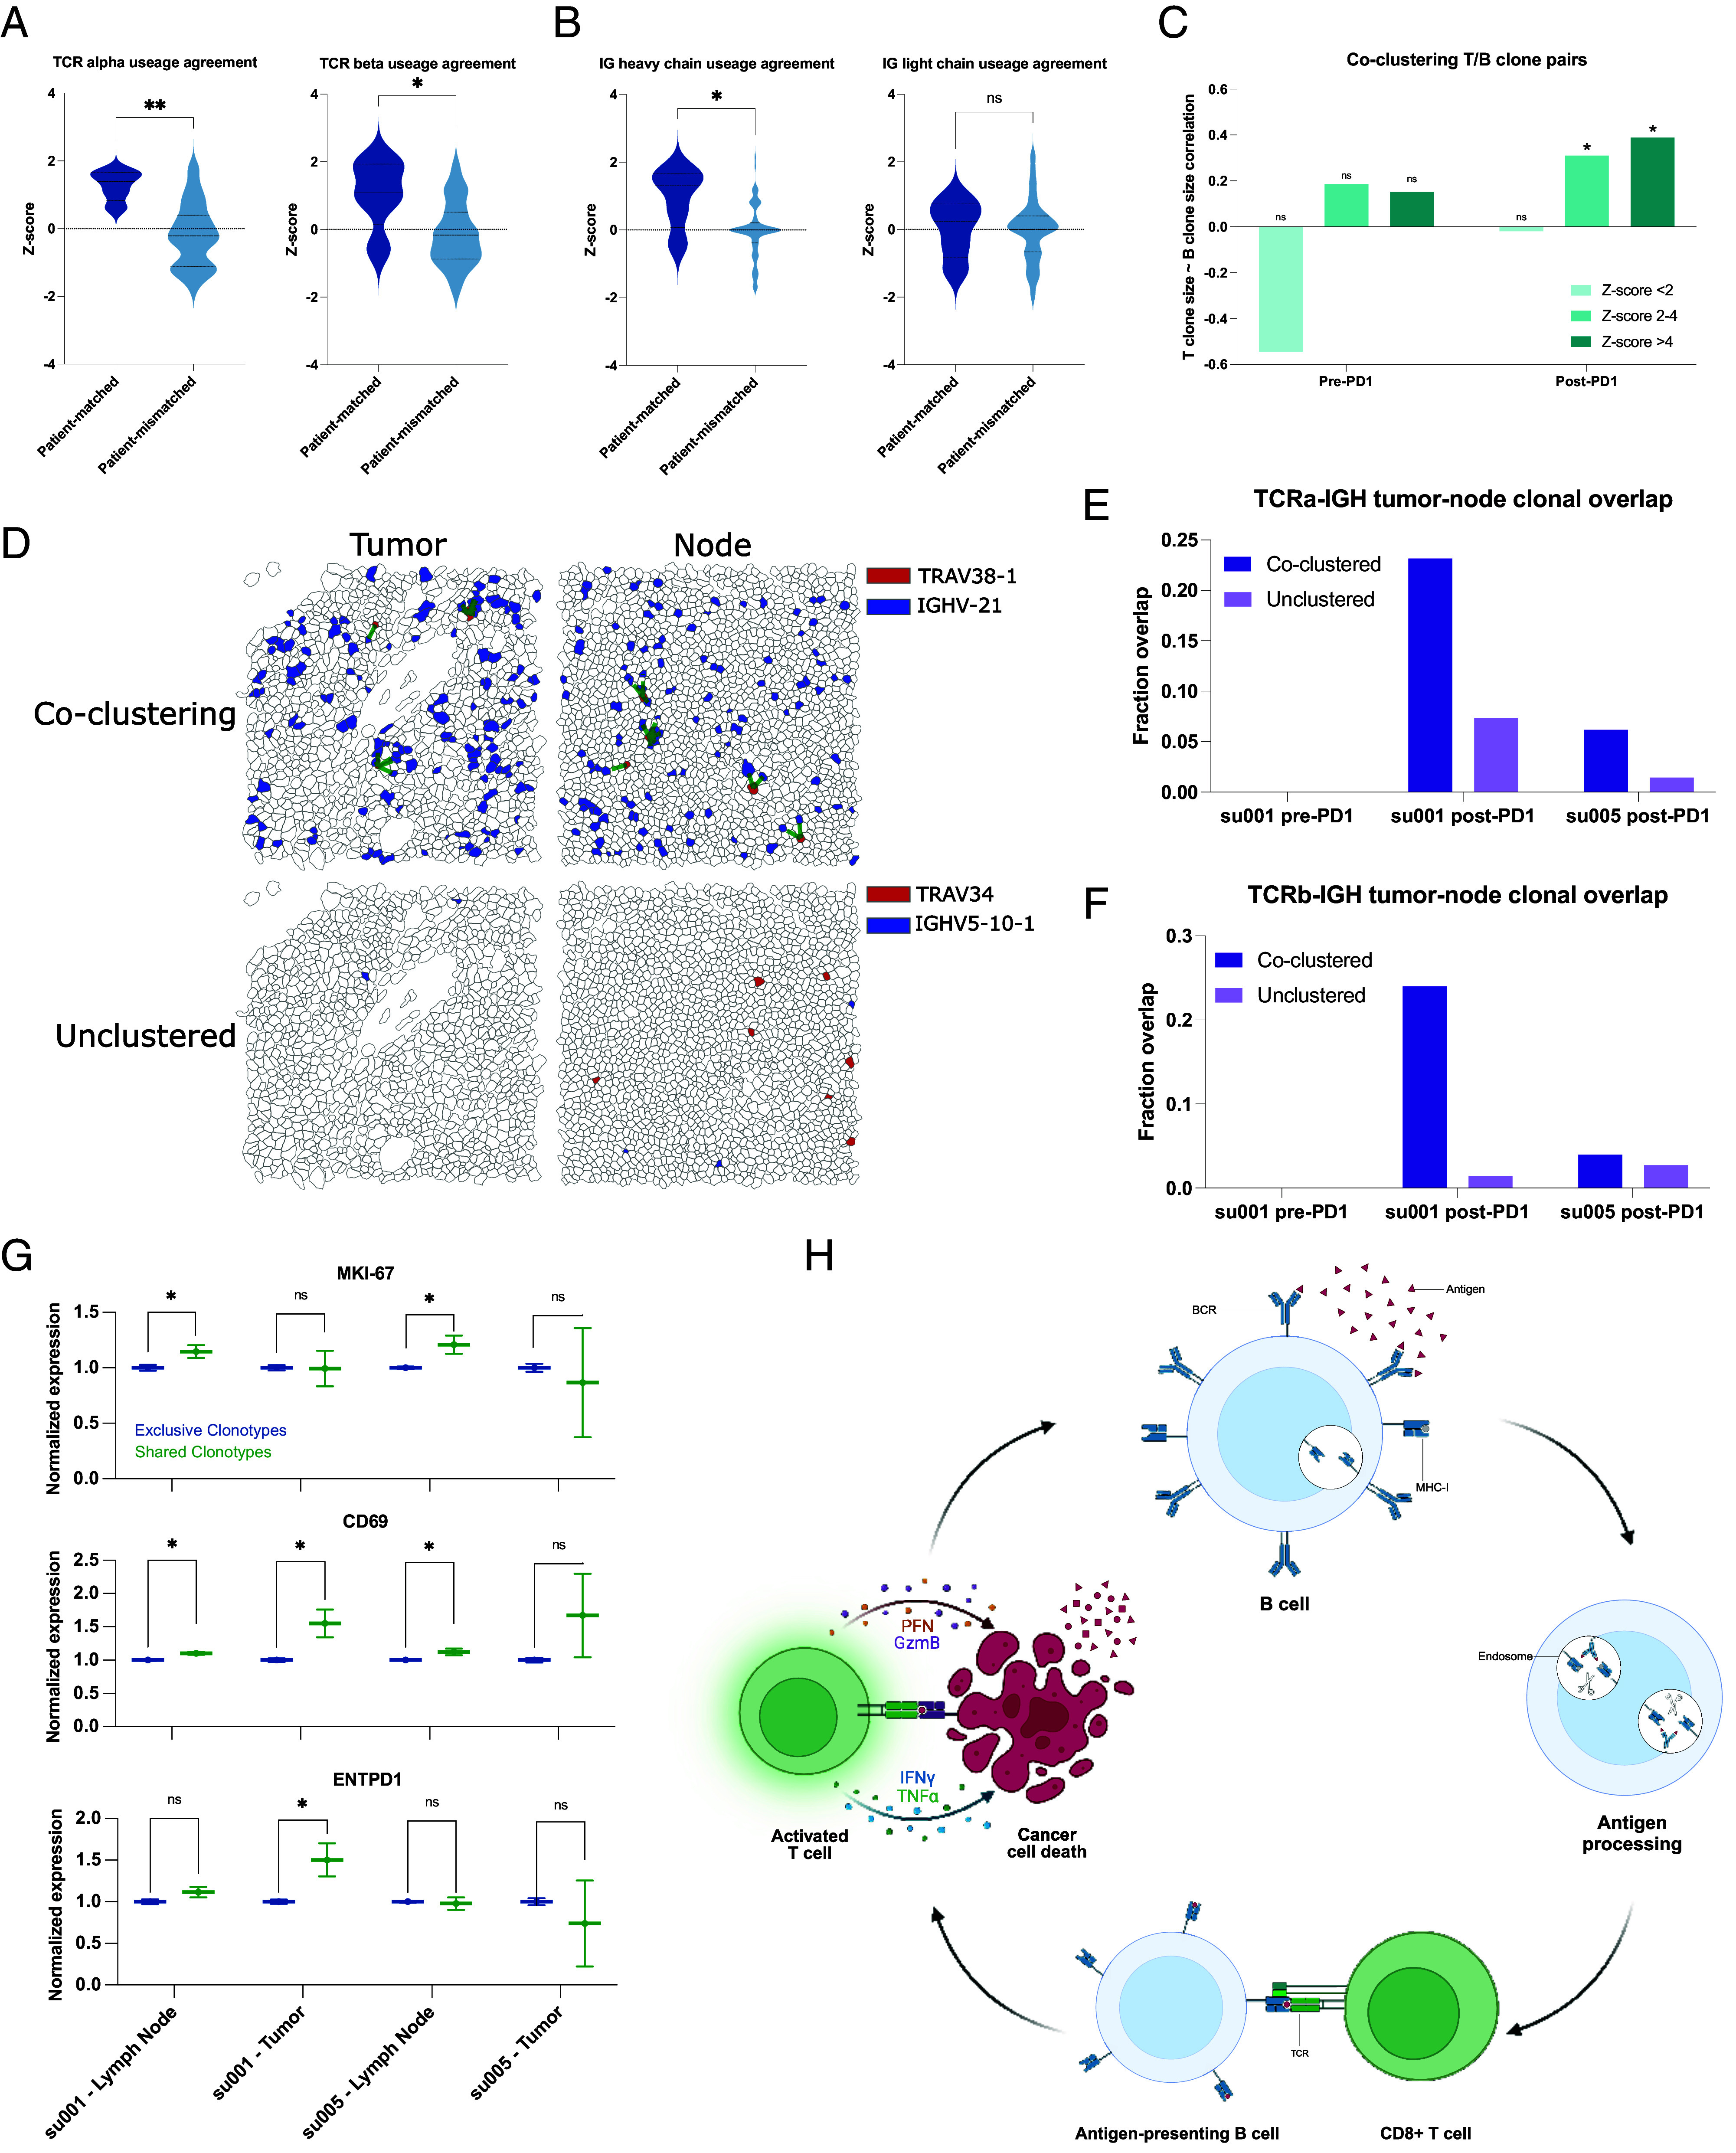
Immune checkpoint inhibitors such as anti-Programmed Death-1 antibodies (aPD-1) can be effective in treating advanced cancers. However, many patients do not respond, and the mechanisms underlying these differences remain incompletely understood. In this study, we profile a cohort of patients with locally advanced or metastatic basal cell carcinoma undergoing aPD-1 therapy using single-cell RNA sequencing, high-definition spatial transcriptomics in tumors and draining lymph nodes, and spatial immunoreceptor profiling, with long-term clinical follow-up. We find that successful responses to PD-1 inhibition are characterized by an induction of B cell receptor (BCR) clonal diversity after treatment initiation. These induced BCR clones spatially colocalize with T cell clones, facilitate their activation, and traffic alongside them between tumor and draining lymph nodes to enhance tumor clearance. Furthermore, we validated aPD-1-induced BCR diversity as a predictor of clinical response in a larger cohort of glioblastoma, melanoma, and head and neck squamous cell carcinoma patients, suggesting that this is a generalizable predictor of treatment response across many types of cancers. We find that pretreatment tumors harbor a characteristic gene expression signature that portends a higher probability of inducing BCR clonal diversity after aPD-1 therapy, and we develop a machine learning model that predicts PD-1-induced BCR clonal diversity from baseline tumor RNA sequencing. These findings underscore a dynamic role of B cell diversity during immunotherapy, highlighting its importance as a prognostic marker and a potential target for intervention in non-responders.

Keywords: PD-1 inhibition; basal cell carcinoma; cancer; immunotherapy; spatial transcriptomics.


Conflict of interest statement

Competing interests statement:H.Y.C. is a cofounder of Accent Therapeutics, Boundless Bio, Cartography Biosciences, Orbital Therapeutics. H.Y.C. was an advisor of Arsenal Biosciences, Chroma Medicine, Exai Bio and Spring Science until December 15, 2024. H.Y.C. is an employee and stockholder of Amgen as of December 16, 2024. H.Y.C. was on the Scientific Advisory Board of Arsenal Bio (2019 to 2024), where one reviewer Z.Z. currently works. This work was was submitted for publication after H.Y.C.’s relationship with Arsenal Bio ended. A.L.S.C. has served as a clinical investigator and/or consultant for Merck, Regeneron, Sun Pharma, Feldan, and Castle Biosciences. A.T.S. is a founder of Immunai, Cartography Biosciences, Santa Ana Bio, and Prox Biosciences, an advisor to Zafrens and Wing Venture Capital, and receives research funding from Astellas and Northpond Ventures. The remaining authors declare no competing interests.

Figures

Fig. 1.
Fig. 1.
Long-term survival of advanced BCC patients highlights prognostic role of aPD-1- induced BCR clonal diversity. (A) A schematic diagram of our BCC patient cohort. (Top) A retrospective chart review was performed after an extended period of clinical follow-up lasting up to 2,564 d to allow final clinical outcomes of PD-1 blockade to manifest. (Bottom) A visualization of the samples taken for our prior study (7) and this study. All patients had pre- and post-PD-1 inhibitor-treated tumor samples for scRNA-seq (circles). All available archived specimens in long-term storage were accessed (squares and triangles) and processed for spatial transcriptomics. Numbers within the shapes represent replicates taken from sequential sections of the sample tissue block. The y-axis represents anonymized patient identifiers while the x-axis represents time (not to exact scale). (B) Unique TCR and (C) BCR clonotype counts detected per patient in their pre-PD-1 inhibitor tumor (X-axis) and post-PD-1 inhibitor treated tumor (Y axis) as calculated by TRUST4 run on 5′ single cell RNA sequencing as described (Materials and Methods). Point sizes represent the total cell count obtained from tumors of each patient. (D) Change in unique TCR and (E) BCR clonotype counts between pre-PD-1 inhibitor and post-PD-1 inhibitor tumors for each patient (Y-axis), stratified by clinical status at last available follow-up. (F) Kaplan–Meier curve of overall survival for our BCC patient cohort stratified by the change in pre-to-post PD-1 inhibitor TCR and (G) BCR clonotype count. P-values calculated using the log-rank test.
Fig. 2.
Fig. 2.
Spatial transcriptomics merged with scRNA-seq enables exploration of the BCR diversity-impacted tumor microenvironment. (A) Representative tissue samples obtained from Xenium in situ for patient su001 for tumor (Top) and regional lymph node (Bottom). Cells from Xenium were merged onto the same latent space (Middle) as cells from our prior scRNA-seq (Left and Middle) using the computational tool ENVI (Materials and Methods). Proposed cell types for Xenium cells were determined using a nearest-neighbor approach in the high-dimensional ENVI latent space. Xenium tissues are downsampled to 40% of total cells for visualization purposes. (B) Diffusion plots of CD8+ T cell populations from scRNA-seq highlighting pseudotime, (C) total unique BCR clonotype count present in the originating tumor of each T cell, (D) annotated subtype of each T cell (Bottom), (E) and size of the originating T cell clonotype. (F) Regression analysis of cell-type contributions to gene expression correlations to BCR-clonotype counts. Left heatmap represents the correlation across scRNA-seq tissue specimens between the annotated gene and the unique BCR clonotype count in that tissue specimen. The 25 most correlated genes (Left), 25 most anticorrelated genes (Right), and 25 random genes (Middle) are shown. The middle heatmap grid represents the change in correlation strength of each gene (row) when a particular cluster (column) is blinded to the correlation calculation. The heatmap on the Bottom row represents the total cell counts assigned to each cluster to verify that effect sizes are not solely influenced by cluster size.
Fig. 3.
Fig. 3.
Clonally diverse B cells cocluster with paired T cell clones with an activated phenotype. (A) Correlations of V-gene usage between those detected using TRUST4 analysis of scRNA-seq vs. those detected in Xenium in situ for TCRs. “Patient-matched” refers to correlations between Xenium samples and scRNA-seq samples originating from the same patient at the same clinical time point, whereas “patient-mismatched” refers to correlations between different patients or different clinical timepoints. (B) Correlations of V-gene usage between scRNA-seq vs. Xenium for IG-genes. (C) Correlation of T cell “pseudoclone” sizes with paired B cell pseudoclone sizes as a function of PD-1 inhibitor exposure of the originating tumor tissue and degree of spatial coclustering between those T and B “pseudoclones.” (D) Representative images of tumor and lymph node samples from patient su001 highlighting a pair of coclustered pseudoclones and a pair of unclustered pseudoclones. Green lines represent T/B cell clones within 20 µm of each other. (E) Fraction of TCRα pseudoclone pairs present in the draining lymph node samples that are also present in the respective tumor sample of that patient. All lymph node samples were collected post-PD-1 inhibitor treatment. Patient su005 had no remaining archived pre-PD-1 inhibitor tumor to be analyzed. (F) Fraction of TCRβ pairs present in both draining lymph nodes and tumors. (G) Normalized gene expression by patient and tissue compartment for T cell clones that are present in both lymph nodes and tumor (shared) vs. those present in a single compartment (exclusive). (H) Schematic diagram of a proposed mechanism of antigen cross-presentation by B cells to CD8+ T cells leading to a cycle of tumor clearance and generation of additional tumor neo-antigens.
Fig. 4.
Fig. 4.
Meta-analysis of BCC, glioblastoma, melanoma, and HNSCC reveals a general prognostic role for aPD1-induced BCR diversity. (A) ∆BCR clonotype count from pre-PD1 inhibitor to post-PD-1-inhibitor of patients with progressed tumors vs. nonprogressed tumors. (B) Kaplan–Meier curve of overall survival for aggregate cancer patients stratified by induced BCR expansion from PD-1 inhibitor. (C) Hazard ratios of overall survival for aggregate cancer patients by BCR or TCR clonotype. An increased clonotype diversity is defined by a greater number of clonotypes detected in post-PD-1 treated tumors compared to prior. Diversity in the case of static measurements at baseline or on-treatment is defined as an above-median BCR or TCR clonotype count. (D, Left) Volcano plot of differentially expressed genes in pretreatment tumors that undergo induced BCR expansion vs. those without. (Right) GO-terms enriched in pretreatment tumors that undergo induced BCR expansion vs. those without. (E, Left) Volcano plot of differentially expressed genes in posttreatment tumors that undergo induced BCR expansion vs. those without. (Right) GO-terms enriched in posttreatment tumors that undergo induced BCR expansion vs. those without.
Fig. 5.
Fig. 5.
Pretreatment tumor RNA sequencing can be leveraged to model aPD-1-induced BCR diversity and clinical outcomes. (A) Prediction model applied to a new melanoma patient cohort. Mosaic plot of clinical response by RECIST stratified by model prediction of induced BCR clonotype expansion. BR: Best response, CR: Complete response, MR: Marginal response, PD: Progressed disease, PR: Partial response, SD: Stable disease. (B) Kaplan–Meier curve of progression-free survival stratified by model prediction of induced BCR clonotype expansion in melanoma patients treated with PD1 inhibitor (Left) and other, non-PD1 therapies (Right). (C) Kaplan–Meier curve of overall survival stratified by model prediction of induced BCR clonotype expansion in melanoma patients treated with PD-1 inhibitor (Left) and other, non-PD-1 therapies (Right).

Update of

Similar articles

References

    1. Li H., Van Der Merwe P. A., Sivakumar S., Biomarkers of response to PD-1 pathway blockade. Br. J. Cancer 126, 1663–1675 (2022). - PMC - PubMed
    1. Betof Warner A., et al. , Long-term outcomes and responses to retreatment in patients with melanoma treated with PD-1 blockade. J. Clin. Oncol. 38, 1655–1663 (2020). - PMC - PubMed
    1. Sharma P., Hu-Lieskovan S., Wargo J. A., Ribas A., Primary, adaptive, and acquired resistance to cancer immunotherapy. Cell 168, 707–723 (2017). - PMC - PubMed
    1. Meliante P. G., et al. , Diagnostic predictors of immunotherapy response in head and neck squamous cell carcinoma. Diagnostics 13, 862 (2023). - PMC - PubMed
    1. Cristescu R., et al. , Pan-tumor genomic biomarkers for PD-1 checkpoint blockade–based immunotherapy. Science 362, eaar3593 (2018). - PMC - PubMed

MeSH terms

Substances

LinkOut - more resources