. 2025 May 2;21(5):e1011690.
doi: 10.1371/journal.pgen.1011690. eCollection 2025 May.

Glycolytic disruption restricts Drosophila melanogaster larval growth via the cytokine Upd3

Affiliations

Glycolytic disruption restricts Drosophila melanogaster larval growth via the cytokine Upd3

Madhulika Rai et al. PLoS Genet. .

Abstract

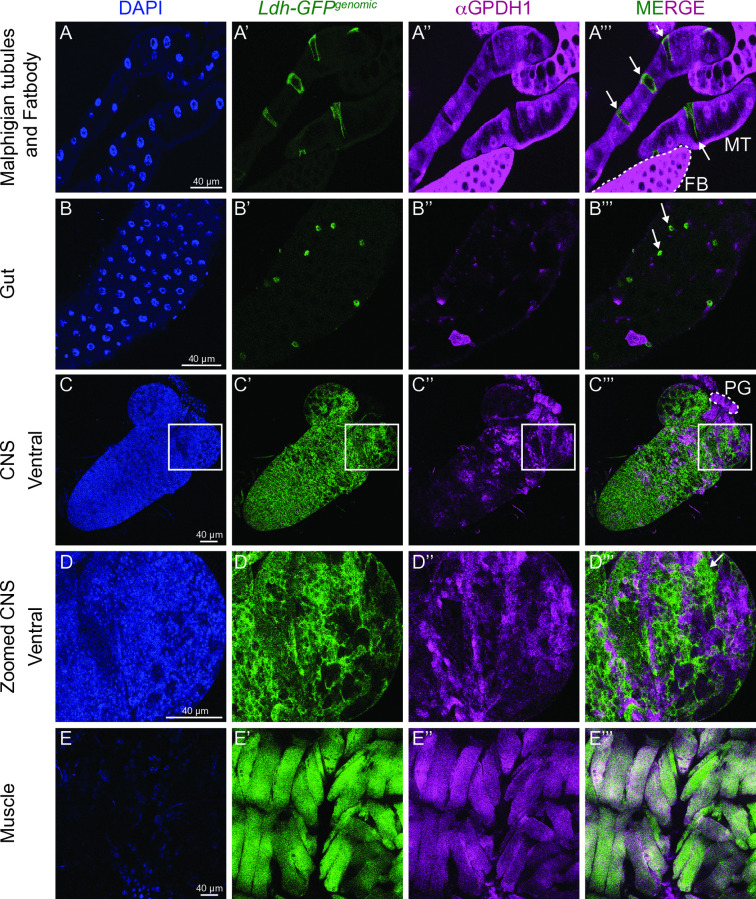
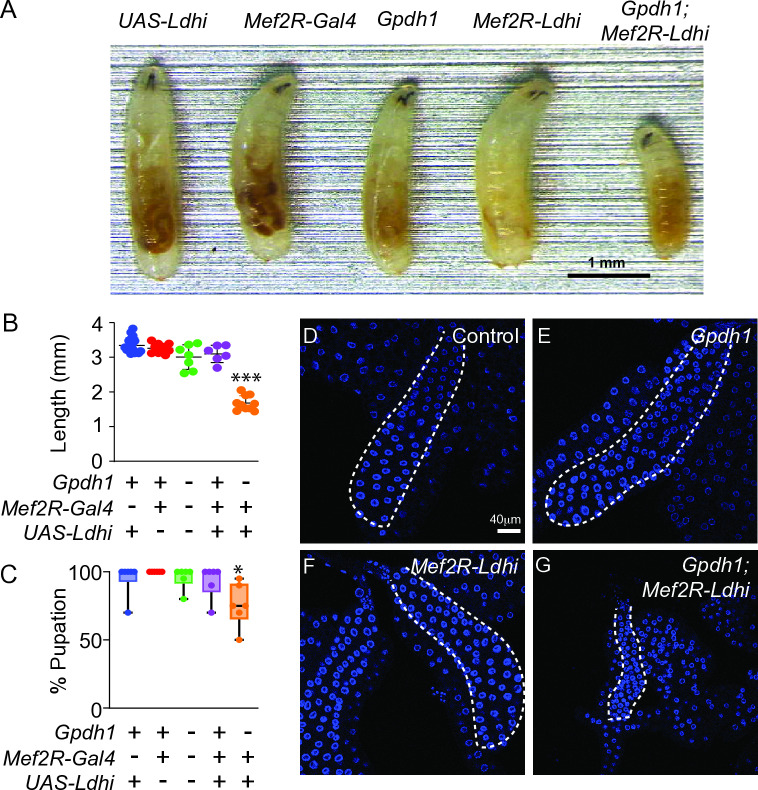
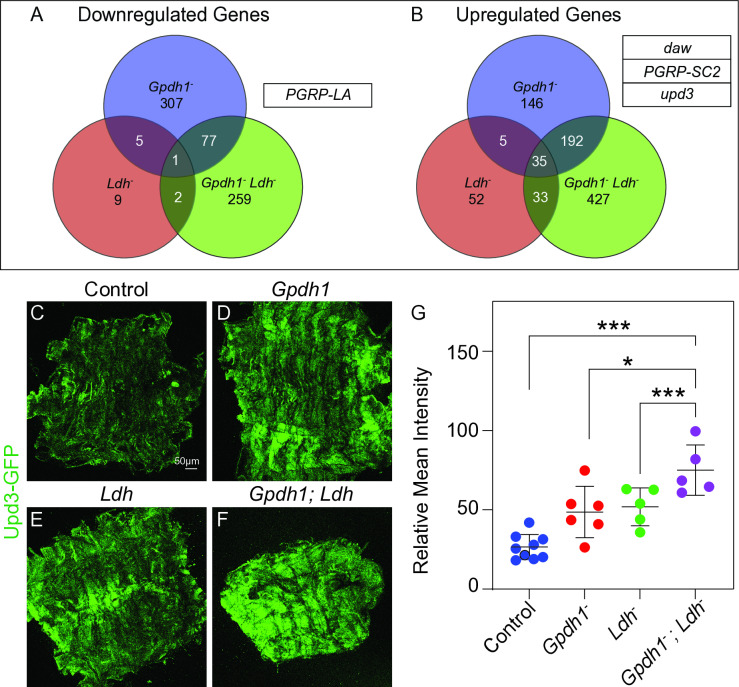
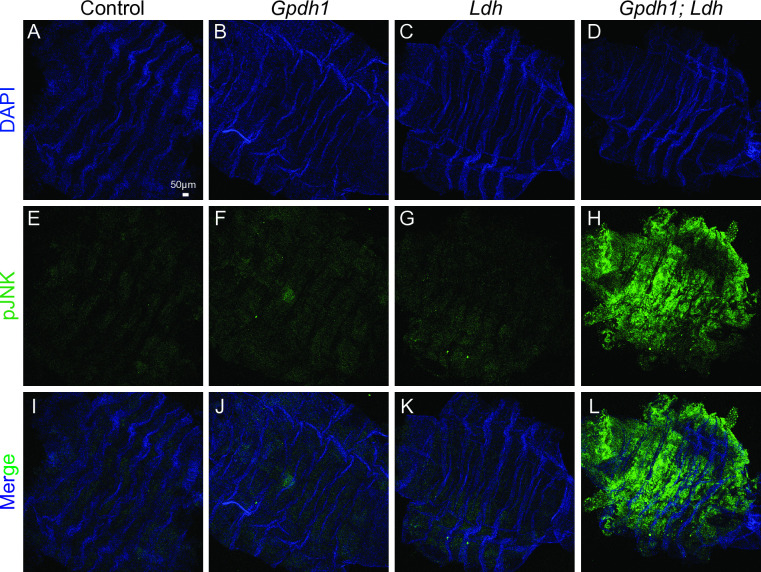
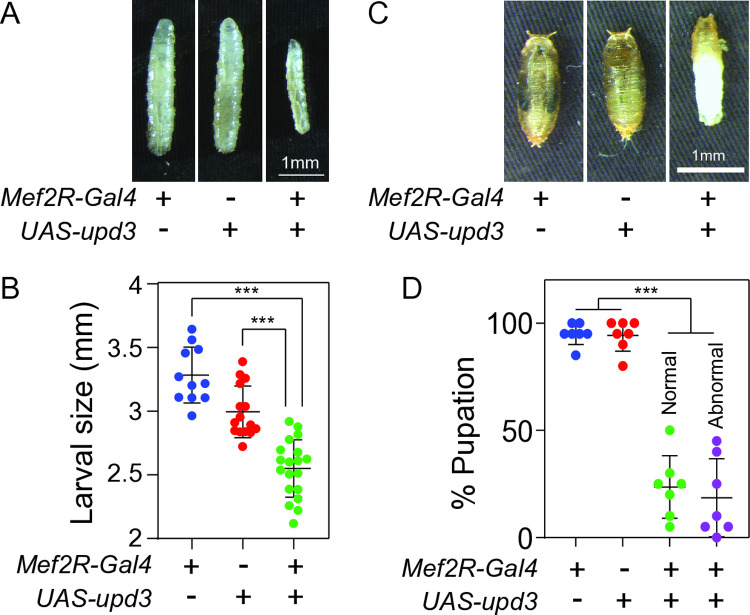
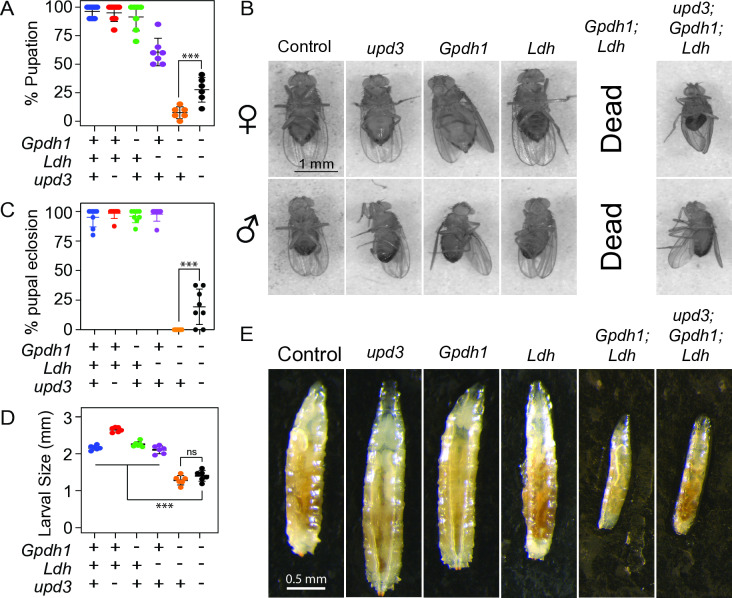
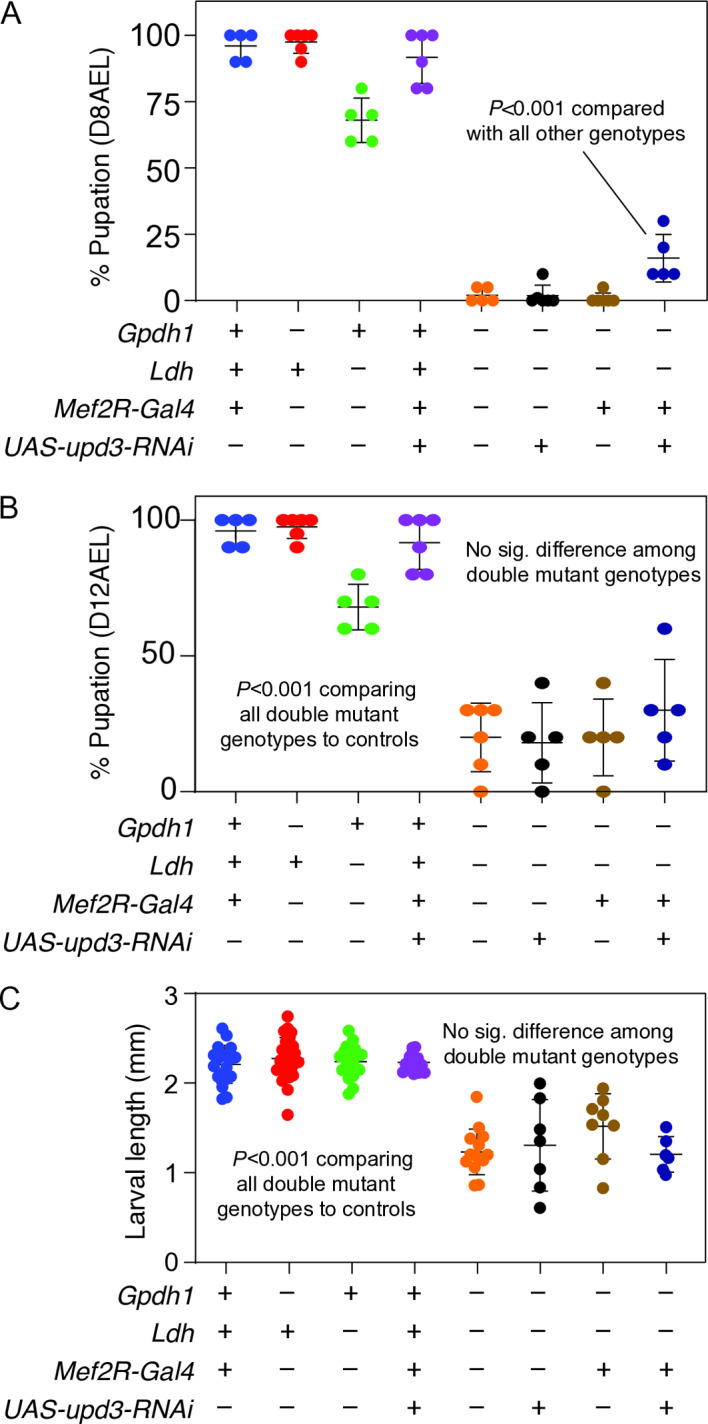
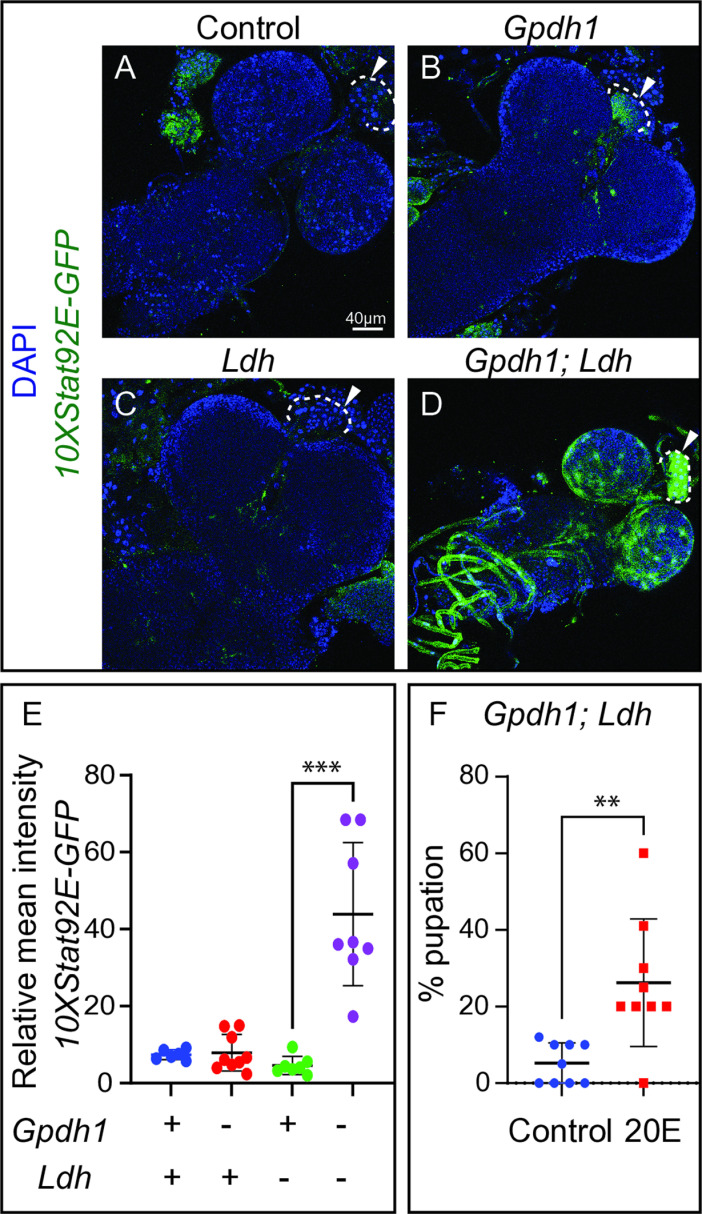
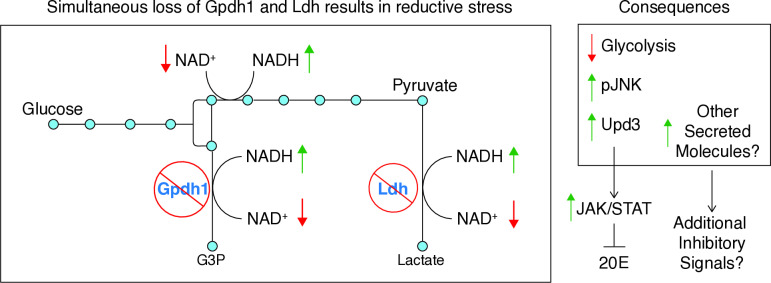
Drosophila larval growth requires efficient conversion of dietary nutrients into biomass. Lactate dehydrogenase (Ldh) and glycerol-3-phosphate dehydrogenase (Gpdh1) support this larval metabolic program by cooperatively promoting glycolytic flux. Consistent with their cooperative functions, the loss of both enzymes, but not either single enzyme alone, induces a developmental arrest. However, Ldh and Gpdh1 exhibit complex and often mutually exclusive expression patterns, suggesting that the lethal phenotypes exhibited by Gpdh1; Ldh double mutants could be mediated non-autonomously. Supporting this possibility, we find that the developmental arrest displayed by double mutants extends beyond simple metabolic disruption and instead stems, in part, from changes in systemic growth factor signaling. Specifically, we demonstrate that the simultaneous loss of Gpdh1 and Ldh results in elevated expression of Upd3, a cytokine involved in Jak/Stat signaling. Furthermore, we show that upd3 loss-of-function mutations suppress the Gpdh1; Ldh larval arrest phenotype, indicating that Upd3 signaling restricts larval development in response to decreased glycolytic flux. Together, our findings reveal a mechanism by which metabolic disruptions can modulate systemic growth factor signaling.


Conflict of interest statement

The authors have declared that no competing interests exist.

Figures

Fig 1
Fig 1. Ldh and Gpdh1 expression patterns are complex and non-strictly overlapping.
Representative confocal images of second instar larval tissues expressing Ldh-GFPGenomic and immuno-stained with αGpdh1 antibody. DAPI is shown in blue, Ldh-GFP and Gpdh1 are represented in green and magenta, respectively. The rightmost panel displays the merged images of Ldh-GFP and Gpdh1 staining. (A-A”’) Malpighian tubules, (B-B”’) gut, (C-C”’) ventral side of CNS, (D-D”’) magnification of the outlined region of interest in (C-C”’), and (E-E”’) muscles. Arrows in (A”’), (B”’) and (D”’) denote non-overlapping Ldh expression. The scale bar represents 40 μM.
Fig 2
Fig 2. Tissue-specific loss of Ldh and Gpdh1 induces systemic growth defects.
Growth and development of both control (Mef2R-Gal4 and UAS-Ldhi) and mutant strains (Gpdh1A10/B18 mutants, Mef2R-Ldhi, and Gpdh1A10/B18; Mef2R-Ldhi) were monitored throughout larval development. Note that UAS-Ldhi is an abbreviation for UAS-Ldh-RNAi. (A) Representative larval images from the indicated genotypes at 6 days after egg-laying (AEL). The scale bar represents 1 mm. (B-C) Quantification of (B) larval length and (C) percent of larvae that pupated eight days AEL from the indicated genotypes. All experiments were repeated a minimum of three times. (B, C) n ≥ 5 biological replicates. Data presented as a scatter plot with the lines representing the mean and standard deviation. P-values were calculated using an ANOVA followed by a Holm-Sidak test. *P < 0.05, ***P < 0.001. (D-G) Representative images of salivary glands dissected from the indicated genotypes. DAPI is shown in blue. The scale bar represents 40 μM. The scale bar in (D) applies to (E,F,G).
Fig 3
Fig 3. Gpdh1; Ldh double mutants display increased upd3 expression.
RNA-seq was used to analyze gene expression in L2 larvae of Gpdh1A10/B18 mutants relative to Gpdh1A10/+ heterozygous controls, Ldh16/17 mutants relative to Ldh16/+ heterozygous controls, and Gpdh1A10/B18; Ldh16/17 double mutants relative to Gpdh1A10/+; Ldh16/+ heterozygous controls. (A-B) Venn diagrams showing the overlap between the number of genes that were either (A) downregulated or (B) upregulated in either single mutant (Gpdh1A10/B18 and Ldh16/17) as well as the double mutant (Gpdh1A10/B18; Ldh16/17) relative to the respective heterozygous control strains. Genes listed in (A, B) encode secreted factors that exhibited significant differential expression in only the Gpdh1A10/B18; Ldh16/17 double mutant. (C-F) Representative confocal images of upd3-GFP expression in the muscles of (C) Gpdh1A10/+; Ldh16/+ heterozygous controls, (D) Gpdh1A10/B18 single mutants, (E) Ldh16/17 single mutants, and (F) Gpdh1A10/B18; Ldh16/17 double mutants. The scale bar representing 50 μM in (C) applies to all other panels. (G) Quantification of upd3-GFP levels in the larval muscles. Data presented as a scatter plot with the lines representing the mean and standard deviation. P-values were calculated using an ANOVA followed by a Holm-Sidak test. *P < 0.05.
Fig 4
Fig 4. Gpdh1; Ldh double mutants display elevated JNK activation in the larval muscles.
(A-L) Representative confocal images of anti-pJNK and DAPI in the larval muscles of (A,E,I) heterozygous controls (Gpdh1A10/+; Ldh16/+), (B,F,J) Gpdh1A10/B18 single mutants, (C,G,K) Ldh16/17 single mutants, and (D,H,L) Gpdh1A10/B18; Ldh16/17 double mutants at 74-80 hrs after egg-laying. DAPI is shown in blue and anti-pJNK in green. The scale bar representing 50 μM in (C) applies to all other panels.
Fig 5
Fig 5. Overexpression of Upd3 in larval muscle inhibits growth and disrupts pupal development.
(A) Representative larval images of the indicated genotypes 6 days after egg-laying (AEL). The scale bar represents 1 mm and applies to all panels. (B) Quantification of the larval size for the indicated genotypes at 6 days AEL. (C) Representative images of pupae from indicated genotypes at 12 days AEL. Note that Mef2R-upd3 expression induces incomplete metamorphosis, as evident by the presence of larval cuticle over the posterior region. (D) The rate of pupation was quantified for larvae of the indicated genotypes 12 days AEL. For Mef2R-upd3 expression, pupae with a normal morphological appearance were quantified separately from those with abnormal larval characteristics. For (B,D), data presented as a scatter plot with the lines representing the mean and standard deviation. P-values were calculated using an ANOVA followed by a Holm-Sidak test. ***P < 0.001.
Fig 6
Fig 6. upd3 loss-of-function mutations suppress the synthetic lethal phenotype of Gpdh1A10/B18; Ldh16/17 double mutants.
(A) The rate of pupation was quantified for larvae of the indicated genotypes 12 days after egg-laying (AEL). Triple mutant larvae (upd3Δ; Ldh16/17; Gpdh1A10/B18) pupated at a significantly higher rate when compared with Gpdh1A10/B18; Ldh16/17 double mutants. (B,C) A significant number of male and female triple mutant pupae successfully completed metamorphosis whereas all Gpdh1A10/B18; Ldh16/17 pupae failed to eclose. (B) Representative images of adults from the control and triple mutant strains. No double mutant adults were observed in 3 independent experiments. (C) Quantification of pupal viability for the indicated genotypes. (D) Quantification of the larval size for the indicated genotypes 6 days AEL. There was no significant difference between the length of double and triple mutant larvae. (E) Representative images of the larvae measured in (D). For (B), the scale bars represent 1 mm and applies to all images in the respective panels. For (E), the scale bars represent 0.5 mm and applies to all images in the respective panels. Data presented in (A,C,D) as a scatter plot with the lines representing the mean and standard deviation. P-values were calculated using an ANOVA followed by a Holm-Sidak test. ***P < 0.01.
Fig 7
Fig 7. RNAi targeting of upd3 expression in muscle of Gpdh1; Ldh double mutant partially suppresses the developmental arrest phenotype.
(A,B) The percentage of pupation was quantified for larvae of the indicated genotypes at (A) 8 days after egg-laying (AEL) and (B) 12 days AEL. (A) Ldh16/17; Gpdh1A10/B18 double mutant larvae expressing Mef2R-upd3-RNAi exhibited significantly higher levels of pupation at 8 days AEL when compared with all double mutant controls. (B) By 12 days AEL, the number of pupae present within vials of Ldh16/17; Gpdh1A10/B18 double mutant controls was similar to that found in vials of double mutants expressing Mef2R-upd3-RNAi. (C) Quantification of the larval size for the indicated genotypes. No significant difference in body length was observed between Ldh16/17; Gpdh1A10/B18 double mutant larvae expressing Mef2R-upd3-RNAi and double mutant controls at 74-80 hrs AEL. Data presented as a scatter plot with the lines representing the mean and standard deviation. P-values were calculated using an ANOVA followed by a Holm-Sidak test. ***P < 0.01.
Fig 8
Fig 8. 20E dietary supplementation partially suppresses the Gpdh1; Ldh double mutants larval arrest phenotype.
(A-D) Representative confocal images of Stat-GFP expression in the central nervous system and prothoracic gland (PG) of Gpdh1A10/B18; Ldh16/17 double mutants as compared to the heterozygous control (Gpdh1A10/+; Ldh16/+) and single mutant strains (Gpdh1A10/B18 and Ldh16/17) at 12 days after egg-laying (AEL). DAPI is shown in blue and Stat-GFP expression in green. The scale bar in (A) represents 40 μM and applies to (B-D). White dashed line marks the PG in panels (A-D). (E) Quantification of Stat-GFP expression in the PG of indicated genotypes at 74–80 hrs AEL. (F) A graph illustrating the percent of Gpdh1A10/B18; Ldh16/17 double mutant that pupated when raised on yeast-molasses agar that contains either 20-hydroxyecdysone (20E) or the solvent (ethanol) control at 12 days AEL. (E,F) Data presented as a scatter plot with the lines representing the mean and standard deviation. (E) P-values were calculated using an ANOVA followed by a Holm-Sidak test. ***P < 0.01. (F) P value was calculated using a Mann-Whitney test. **P < 0.01.
Fig 9
Fig 9. A proposed model for how loss of Ldh and Gpdh1 activity nonautonomously restricts larval growth.
Loss of Gpdh1 and Ldh activity results in reductive stress, decreased glycolytic flux, and elevated upd3 expression within the larval tissue. Increased Upd3 levels trigger systemic activation of JAK/STAT signaling in larval tissues, including in the PG. Consequently, 20E titers are reduced, thus impeding larval development. We would hypothesize, however, that additional factors are likely involved in the double mutant developmental phenotypes, as supported by the RNA-seq data and the fact that loss of Upd3 does not completely suppress the double mutant phenotypes. Moreover, some aspects of the developmental phenotypes are inevitably the result of metabolic limitations. Future studies will be required to disentangle the distinct phenotypic contributions of signal transduction cascades and metabolic bottlenecks within double mutant larvae.

Similar articles

References

    1. Miyazawa H, Aulehla A. Revisiting the role of metabolism during development. Development. 2018;145(19):dev131110. doi: 10.1242/dev.131110 - DOI - PubMed
    1. Garfinkel AM, Ilker E, Miyazawa H, Schmeisser K, Tennessen JM. Historic obstacles and emerging opportunities in the field of developmental metabolism - lessons from Heidelberg. Development. 2024;151(12):dev202937. doi: 10.1242/dev.202937 - DOI - PMC - PubMed
    1. Bland ML. Regulating metabolism to shape immune function: lessons from Drosophila. Semin Cell Dev Biol. 2023;138:128–41. doi: 10.1016/j.semcdb.2022.04.002 - DOI - PMC - PubMed
    1. Deng H, Kerppola TK. Regulation of Drosophila metamorphosis by xenobiotic response regulators. PLoS Genet. 2013;9(2):e1003263. doi: 10.1371/journal.pgen.1003263 - DOI - PMC - PubMed
    1. Koyama T, Texada MJ, Halberg KA, Rewitz K. Metabolism and growth adaptation to environmental conditions in Drosophila. Cell Mol Life Sci. 2020;77(22):4523–51. doi: 10.1007/s00018-020-03547-2 - DOI - PMC - PubMed

MeSH terms

LinkOut - more resources