. 2025 May 2;11(18):eads8323.
doi: 10.1126/sciadv.ads8323. Epub 2025 May 2.

Noninvasive prognostic classification of ITH in HCC with multi-omics insights and therapeutic implications

Affiliations

Noninvasive prognostic classification of ITH in HCC with multi-omics insights and therapeutic implications

Yangyang Xie et al. Sci Adv. .

Abstract

Intratumoral heterogeneity (ITH) is a critical factor associated with treatment failure and disease relapse in hepatocellular carcinoma (HCC). However, decoding ITH in a noninvasive and comprehensive manner remains a notable challenge. In this study involving 851 patients from five centers, we developed a noninvasive prognostic classification for ITH using radiomics based on multisequence MRI, termed radiomics ITH (RITH) phenotypes. The RITH phenotypes highly correlated with prognosis and pathological ITH. In addition, through an integrated multi-omics analysis, we uncovered the molecular mechanisms underlying RITH, notably enhancing its biological interpretability. Specifically, high-RITH tumors demonstrated an enrichment of cancer-associated fibroblasts and activation of extracellular matrix remodeling. Our approach facilitates the noninvasive refined classification of ITH using radiomics and multi-omics, paving the way for tailored treatment strategies in HCC. Extracellular matrix-receptor interaction could be a potential therapeutic target in patients with high-RITH tumors. Given the routine use of radiologic imaging in oncology, our methodology ignites versatile framework for broader application to other solid tumors.


Figures
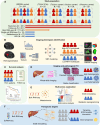
Fig. 1.
Fig. 1.. Study design of the imaging-based multi-omics analysis.
(A) Study population. (B) Imaging phenotypes identification. (C) Survival analysis. (D) Imaging and pathological ITH. (E) Multi-omics explanation. (F) Therapeutic targets.
Fig. 2.
Fig. 2.. Identification of RITH phenotypes in HCC.
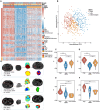
(A) Heatmap displaying unsupervised clustering of radiomic features associated with heterogeneity using SNF, including features notably correlated with the RITH subtype. Grade, MVI status, and T stage are annotated. (B) Principal components (PC) analysis plot of samples from three different subtypes. (C to F) HI in the SRRSH (C), Taizhou (D), Huzhou (E), and Wenzhou (F) centers. Median HI values: SRRSH (high: 255.1, low: −222.5), Taizhou (high: 229.5, low: −223.1), Huzhou (high: 123.4, low: −31.9), Wenzhou (high: 125.3, low: −34.6). (G) Representative AP-MRI habitat imaging illustrating low-, intermediate-, and high-RITH. LHR, low heterogeneity related; HHR, high heterogeneity related. ***P < 0.001.
Fig. 3.
Fig. 3.. Prognostic classification in different RITH phenotypes.
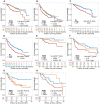
(A and B) Kaplan-Meier survival curves of OS (A) and RFS (B) based on RITH phenotypes within the SRRSH cohort. (C and D) Kaplan-Meier survival curves of OS (C) and RFS (D) grouped by HI in the SRRSH cohort. (E and F) Kaplan-Meier survival curves according to RITH phenotypes for OS (E) and RFS (F) in the Taizhou center. (G and H) Kaplan-Meier survival curves according to RITH phenotypes for RFS in the Huzhou (G) and Wenzhou (H) centers.
Fig. 4.
Fig. 4.. Correlation between imaging and pathological ITH.
(A) Flowchart presenting the extraction and utilization of pathological ITH. (B to D) Cellular morphological ITH scores of representative features: IntensityMax (B), CurvStd (C), and CurvMean (D) extracted from tumor cells. (E) Proportion of different grade stages across the low-, intermediate-, and high-RITH phenotypes. (F to H) Representative pathological images of tumor samples with low- (F), intermediate- (G), and high-RITH (H). ***P < 0.001, **P < 0.01, and *P < 0.05.
Fig. 5.
Fig. 5.. The biological interpretation of RITH phenotypes.
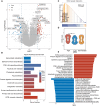
(A) Volcano plots showing DEGs in high-RITH and low-RITH samples in the SRRSH dataset. (B) KEGG pathway analysis based on the DEGs in the SRRSH dataset. (C) GSEA identifying the up-regulation of the ECM-receptor interaction pathway in the high-RITH phenotype in the SRRSH cohort. (D) ECM score in the SRRSH cohort. (E) Bar plot showing the top enriched pathways ordered by the NES in the high-RITH phenotype (red) and low-RITH phenotype (blue) in the SRRSH dataset. **P < 0.01. IgA, immunoglobulin A. PPAR, peroxisome proliferator–activated receptor.
Fig. 6.
Fig. 6.. Identification of therapeutic targets through bulk and single-cell transcriptomics.
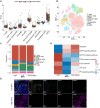
(A) Boxplot of immune cell abundance. (B) t-distributed stochastic neighbor embedding (t-SNE) plot of cells from 15 HCC patients with eight clusters. (C) Bar plots showing the proportion of cell types in different clusters. (D) GSVA of CAFs according to RITH phenotypes. (E) Representative multiplexed immunohistochemistry images of high-RITH and low-RITH tumors, showing CD3, CD8, PD-L1, and α–smooth muscle actin (α-SMA) expression. TAMs, tumor-associated macrophages; TECs, tumor-associated endothelial cells.
Fig. 7.
Fig. 7.. Correlation between ECM-related genes and radiomic features.
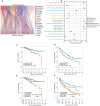
(A) Sankey plot illustrating the correlation between ECM-related genes and radiomic features (P < 0.01), with line thickness indicating the strength of the correlation. (B) Bubble plot showing the correlation between ADAMTS5 expression and radiomic features. (C and D) Kaplan-Meier survival curves of OS (C) and RFS (D) grouped by ADAMTS5 expression in the SRRSH cohort. (E and F) Kaplan-Meier survival curves of OS (E) and RFS (F) grouped by HI and ADAMTS5 expression in the SRRSH cohort.

References

    1. Dentro S. C., Leshchiner I., Haase K., Tarabichi M., Wintersinger J., Deshwar A. G., Yu K., Rubanova Y., Macintyre G., Demeulemeester J., Vázquez-García I., Kleinheinz K., Livitz D. G., Malikic S., Donmez N., Sengupta S., Anur P., Jolly C., Cmero M., Rosebrock D., Schumacher S. E., Fan Y., Fittall M., Drews R. M., Yao X., Watkins T. B. K., Lee J., Schlesner M., Zhu H., Adams D. J., McGranahan N., Swanton C., Getz G., Boutros P. C., Imielinski M., Beroukhim R., Sahinalp S. C., Ji Y., Peifer M., Martincorena I., Markowetz F., Mustonen V., Yuan K., Gerstung M., Spellman P. T., Wang W., Morris Q. D., Wedge D. C., Van Loo P., PCAWG Evolution and Heterogeneity Working Group and the PCAWG Consortium , Characterizing genetic intra-tumor heterogeneity across 2,658 human cancer genomes. Cell 184, 2239–2254.e39 (2021). - PMC - PubMed
    1. Marusyk A., Janiszewska M., Polyak K., Intratumor heterogeneity: The Rosetta stone of therapy resistance. Cancer Cell 37, 471–484 (2020). - PMC - PubMed
    1. McGranahan N., Swanton C., Clonal heterogeneity and tumor evolution: Past, present, and the future. Cell 168, 613–628 (2017). - PubMed
    1. An F. Q., Matsuda M., Fujii H., Tang R. F., Amemiya H., Dai Y. M., Matsumoto Y., Tumor heterogeneity in small hepatocellular carcinoma: Analysis of tumor cell proliferation, expression and mutation of p53 AND beta-catenin. Int. J. Cancer 93, 468–474 (2001). - PubMed
    1. Kenmochi K., Sugihara S., Kojiro M., Relationship of histologic grade of hepatocellular carcinoma (HCC) to tumor size, and demonstration of tumor cells of multiple different grades in single small HCC. Liver 7, 18–26 (1987). - PubMed

MeSH terms

Substances