. 2025 May 2;11(18):eadr2226.
doi: 10.1126/sciadv.adr2226. Epub 2025 May 2.

A neuroimmune pathway drives bacterial infection

Affiliations

A neuroimmune pathway drives bacterial infection

Nian Wang et al. Sci Adv. .

Abstract

Pathogen-induced septic death presents a substantial public health challenge, with its neuroimmune mechanisms largely unexplored. Our study investigates neurotransmitter modulation of ACOD1 expression, a regulator of immunometabolism activated by bacterial lipopolysaccharide (LPS). Screening neurotransmitters identifies dopamine as a potent inhibitor of LPS-induced ACOD1 expression in innate immune cells. Mechanistically, DRD2 forms a complex with TLR4, initiating MAPK3-dependent CREB1 phosphorylation and subsequent ACOD1 transcription. Conversely, dopamine disrupts TLR4-MYD88 interaction via DRD2 without affecting the formation of the LPS-induced TLR4-MD2-CD14 complex. Enhanced ACOD1 expression induces CD274/PD-L1 production independently of itaconate, precipitating inflammation-associated immunosuppression in sepsis. Delayed administration of pramipexole, a dopamine agonist, mitigates lethality in bacterial sepsis mouse models. Conversely, the dopamine antagonist aripiprazole exacerbates sepsis mortality. Dysregulation of the dopamine-ACOD1 axis correlates with sepsis severity in patients, indicating a potential therapeutic target for modulating this neuroimmune pathway.


Figures

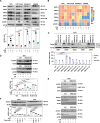
Fig. 1.
Fig. 1.. Identification of dopamine as a negative regulator of LPS-induced ACOD1 up-regulation.
(A) Schematic diagram of the workflow for screening neurotransmitters that can abrogate LPS-induced ACOD1 up-regulation in THP1-M155 cells. (B) Summary diagram of the number of neurotransmitters that can block LPS-induced ACOD1 up-regulation in monocytes and macrophages. (C) Western blot analysis of ACOD1 abundance in THP1 monocytes, iBMDMs, RAW264.7 macrophages, and BV2 microglial cells after LPS (100 ng/ml) stimulation for 6 or 12 hours in the presence of dopamine (0.125 to 1 mM). (D) Western blot analysis of ACOD1 abundance in THP1 monocytes, RAW264.7 macrophages, and BV2 microglial cells after LPS (100 ng/ml) stimulation for 1 to 24 hours in the presence of dopamine (0.5 mM). (E) Western blot analysis of ACOD1 abundance in primary PMs and BMDMs after LPS (100 ng/ml) stimulation for 12 hours in the presence of dopamine (0.5 mM). (F and G) qPCR analysis of ACOD1 mRNA expression in THP1 monocytes (F) and BV2 microglial cells (G) after LPS (100 ng/ml) stimulation for indicated time points in the presence of dopamine (0.5 mM). All the semiquantitative data are presented as means ± SD; n = 3 biologically independent samples. Statistical analysis was carried out using one-way ANOVA with Tukey’s multiple comparisons test. AU, arbitrary units; DA, dopamine.
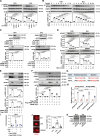
Fig. 2.
Fig. 2.. DRD2 mediates the inhibitory effect of dopamine on LPS-induced ACOD1 up-regulation.
(A) Western blot analysis of dopamine receptor abundance in THP1 monocytes, RAW264.7 macrophages, and iBMDMs after LPS (100 ng/ml) stimulation for 6 hours (THP1 and THP1-M155) or 12 hours (RAW264.7 and iBMDM) in the presence of dopamine (0.5 mM). (B) In the setting of experiment (A), mRNA expressions of DRD1-DRD5 and ACOD1 were assayed by qPCR. The data are presented in a heatmap, representing the mean values of three samples from each group. (C) qPCR analysis of ACOD1 mRNA expression in indicated dopamine receptor–knockdown THP1 monocytes after LPS (100 ng/ml) stimulation for 6 hours in the presence of dopamine (0.5 mM). (D) Western blot analysis of ACOD1 protein expression in DRD2-knockdown BV2 microglial cells after LPS (100 ng/ml) stimulation for 12 hours in the presence of dopamine (0.5 mM). (E) Western blot analysis of ACOD1 protein expression in indicated dopamine receptor–knockout THP1 monocytes after LPS (100 ng/ml) stimulation for 6 hours in the presence of dopamine (0.5 mM). (F) Western blot analysis of ACOD1 protein expression in THP1 monocytes and BV2 microglial cells after LPS (100 ng/ml) stimulation for 12 hours in the presence of DRD2 agonist ropinirole (Rop; 0.125, 0.25, 0.5, and 1 mM). All the semiquantitative data are presented as means ± SD; n = 3 biologically independent samples. Statistical analysis was carried out using one-way ANOVA with Tukey’s multiple comparisons test.
Fig. 3.
Fig. 3.. Phosphorylation of CREB1 mediates inducible ACOD1 expression.
(A) Western blot analysis of CREB1 phosphorylation at S133 in THP1 and BV2 cells after LPS (100 ng/ml) stimulation for 1 or 3 hours in the presence of dopamine. (B) Temporal dynamics of CREB1 phosphorylation at S133 in response to LPS with dopamine (0.5 mM) over various periods. (C) ACOD1 protein levels in CREB1-knockdown cells post-LPS challenge for 6 or 12 hours, with dopamine influence. (D) Effects of CREB1 inhibitor 666-15 on ACOD1 protein levels in various cells stimulated with LPS for 6 hours. (E) ACOD1 protein expression in CREB1-knockdown THP1 cells, reintroduced with Flag-CREB1 and stimulated with LPS for 6 hours. (F) Comparative ACOD1 levels in CREB1-deficient THP1 cells expressing either WT or mutant Flag-CREB1 (S133A), post-LPS and dopamine treatment. (G) ACOD1 promoter regions potentially interacting with CREB1, analyzed for mutations. (H) Dual luciferase reporter assays reveal the influence of WT versus mutant CREB1 response elements on ACOD1 promoter activity in transfected 293FT cells. (I) ChIP assays validate CREB1 binding at specific ACOD1 promoter sites in Flag-CREB1 overexpressed THP1 cells, following LPS and dopamine exposure. (J) Imaging analysis of CREB1 localization in BV2 cells following stimulation with LPS in the absence or presence of dopamine for 6 hours. Scale bar, 10 μm. (K) Differential CREB1 distribution in nuclear and cytoplasmic fractions of BV2 cells post-LPS and dopamine exposure. Data are means ± SD, analyzed by ANOVA with Tukey’s test (n = 3 or 10 biologically independent samples).
Fig. 4.
Fig. 4.. The TLR4-MYD88-MAPK3 pathway mediates CREB1 phosphorylation and function.
(A) Dose-dependent impact of PKA inhibitor H-89 on ACOD1 expression post-LPS stimulation (100 ng/ml, 6 hours). (B) ACOD1 expression following LPS exposure and cotreatment with dopamine (0.5 mM) and increasing doses of PKA activator forskolin (10, 50, 100, and 200 μM). (C) Effects of cAMP analog 8-Br-cAMP on ACOD1 expression in dopamine-cotreated cells after LPS stimulation. (D) CREB1 phosphorylation and ACOD1 expression in TLR4-deficient monocytes challenged with LPS for varying durations (1 and 6 hours). (E and F) IP analyses revealing interactions within the TLR4 signaling complex in response to LPS and dopamine in native and DRD2-deficient monocytes. (G) Phosphorylation heatmap illustrating kinase activity shifts over time (1, 3, and 6 hours) post-LPS and dopamine treatment. (H) Effects of MAPK1/3 inhibition (VX-11e, pluripotin, ulixertinib, all 10 μM) on CREB1 and ACOD1 regulation following LPS stimulation. (I and J) Influence of MAPK3 knockdown or overexpression on CREB1 phosphorylation and ACOD1 expression post-LPS challenge. (K) MAPK3 activation dynamics in TLR4-knockdown THP1 cells after LPS exposure. (L) Protein expression profiling in DRD2-deficient monocytes under LPS stimulation for 1 hour. All the semiquantitative data are presented as means ± SD; n = 3 biologically independent samples. Statistical analysis was carried out using one-way ANOVA with Tukey’s multiple comparisons test.
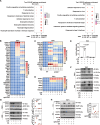
Fig. 5.
Fig. 5.. Dopamine inhibits ACOD1-dependent CD274 expression in an itaconate-independent manner.
(A) Gene Ontology (GO) analysis of RNA-sequencing data from WT and CREB1-knockdown (CREB1KD) THP1 cells reveals the top 5 enriched biological processes among genes up-regulated by LPS (100 ng/ml, 3 hours) and down-regulated following CREB1 knockdown. (B) Heatmaps display mRNA levels of differentially expressed genes (DEGs) in three primary processes: positive regulation of cytokine production, T cell activation, and viral response in ACOD1-knockout THP1 monocytes post-LPS exposure. (C) mRNA expression profiles of DEGs in ACOD1-knockout THP1 cells treated with LPS, with and without 4OI (0.25 mM), for 3 hours. (D) Heatmaps show mRNA expressions of DEGs independent of 4OI modulation in response to LPS with dopamine (0.5 mM) cotreatment. (E) qPCR results for Cd274 mRNA in BV2 cells stimulated with LPS in the presence and absence of dopamine and 4OI. (F and G) Western blots analyze protein levels of ACOD1, CD274, and ISG15 across different treatment conditions in THP1 and BV2 cells, including time points at 6 and 12 hours. (H) Western blot analysis of protein expression in ACOD1-knockout THP1 monocytes after LPS (100 ng/ml) stimulation in the absence or presence of dopamine (0.5 mM) and 4OI (0.25 mM). All the semiquantitative data are presented as means ± SD; n = 3 biologically independent samples. Statistical analysis was carried out using one-way ANOVA with Tukey’s multiple comparisons test.
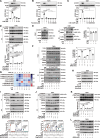
Fig. 6.
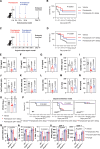
Fig. 6.. Delayed pramipexole treatment protects against endotoxin and sepsis lethality.
(A) Endotoxemia model: C57BL/6J mice received a lethal dose (LD75) of LPS (15 mg/kg, ip) followed by pramipexole (1 mg/kg, ip) or PBS immediately, 12 hours, and 24 hours post-LPS injection. (B) Survival analysis (Kaplan-Meier) comparing pramipexole-treated and control groups in endotoxemia (20 mice per group). (C) Polymicrobial sepsis model: Mice underwent cecal ligation and puncture (CLP), receiving pramipexole (1 mg/kg, ip) at staggered intervals post-CLP without antibiotics. (D) Survival analysis (Kaplan-Meier) for pramipexole-treated and control groups in polymicrobial sepsis (20 mice per group). (E to O) Assays of plasma biomarkers (TNF, IL-6, IL-1B, HMGB1, SQSTM1, ALT, BUN, itaconate), bacterial load in blood, and mRNA levels of Cd274 and Acod1 in PMs from endotoxemia models (five mice per group). (P) Survival analysis (Kaplan-Meier) in CLP-induced sepsis with varying treatments: antibiotics (imipenem, cilastatin), pramipexole, pramipexole + anti-CD274 antibody, and pramipexole + IgG (10 mice per group). (Q and R) mRNA levels of Cd274 in PMs and percentages of CD4+ and CD8+ T cells in the spleen in the CLP model with antibiotics and pramipexole treatments (five mice per group). (S) Assessment of IFNG release from isolated spleen CD4+ and CD8+ T cells exposed to LPS (100 ng/ml) for 2 hours in the CLP model (three mice per group).
Fig. 7.
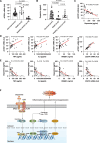
Fig. 7.. Association of the dopamine-ACOD1 axis with the severity of patients with sepsis.
(A and B) Plot of mRNA expression of ACOD1 in PBMCs (A) and circulating dopamine (B) in patients with sepsis (separated into survival and nonsurvival groups) as well as healthy controls. Statistical analysis was carried out using one-way ANOVA with Tukey’s multiple comparisons test. (C) Correlation analysis between circulating dopamine and ACOD1 expression in PBMCs from patients with sepsis (Pearson rank correlation test). (D) Correlation analysis between serum cytokines (TNF, IL-6, and HMGB1) and ACOD1 and CD274 expression in PBMCs from patients with sepsis (Pearson rank correlation test). (E) Correlation analysis between serum cytokines (TNF, IL-6, and HMGB1) and dopamine and CD274 expression in PBMCs from patients with sepsis (Pearson rank correlation test). (F) Schematic summary of the role of dopamine in attenuating dysregulated immune responses in sepsis by inhibiting CREB1-dependent ACOD1 up-regulation.

References

    1. Rudd K. E., Johnson S. C., Agesa K. M., Shackelford K. A., Tsoi D., Kievlan D. R., Colombara D. V., Ikuta K. S., Kissoon N., Finfer S., Fleischmann-Struzek C., Machado F. R., Reinhart K. K., Rowan K., Seymour C. W., Watson R. S., West T. E., Marinho F., Hay S. I., Lozano R., Lopez A. D., Angus D. C., Murray C. J. L., Naghavi M., Global, regional, and national sepsis incidence and mortality, 1990-2017: Analysis for the Global Burden of Disease Study. Lancet 395, 200–211 (2020). - PMC - PubMed
    1. van der Poll T., van de Veerdonk F. L., Scicluna B. P., Netea M. G., The immunopathology of sepsis and potential therapeutic targets. Nat. Rev. Immunol. 17, 407–420 (2017). - PubMed
    1. van der Poll T., Shankar-Hari M., Wiersinga W. J., The immunology of sepsis. Immunity 54, 2450–2464 (2021). - PubMed
    1. Liu D., Huang S.-Y., Sun J.-H., Zhang H.-C., Cai Q.-L., Gao C., Li L., Cao J., Xu F., Zhou Y., Guan C.-X., Jin S.-W., Deng J., Fang X.-M., Jiang J.-X., Zeng L., Sepsis-induced immunosuppression: Mechanisms, diagnosis and current treatment options. Mil. Med. Res. 9, 56 (2022). - PMC - PubMed
    1. Deng W., Zhu S., Zeng L., Liu J., Kang R., Yang M., Cao L., Wang H., Billiar T. R., Jiang J., Xie M., Tang D., The circadian clock controls immune checkpoint pathway in sepsis. Cell Rep. 24, 366–378 (2018). - PMC - PubMed