. 2025 May 2;11(18):eads8597.
doi: 10.1126/sciadv.ads8597. Epub 2025 May 2.

Targeting HMGB2 acts as dual immunomodulator by bolstering CD8+ T cell function and inhibiting tumor growth in hepatocellular carcinoma

Affiliations

Targeting HMGB2 acts as dual immunomodulator by bolstering CD8+ T cell function and inhibiting tumor growth in hepatocellular carcinoma

Wei-Feng Qu et al. Sci Adv. .

Abstract

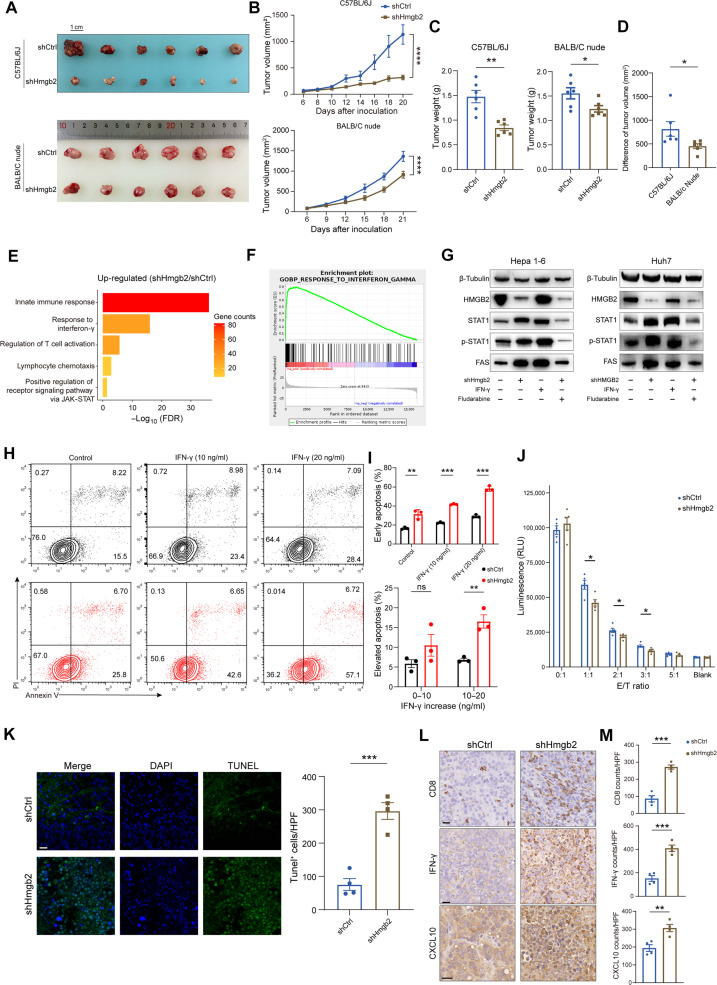
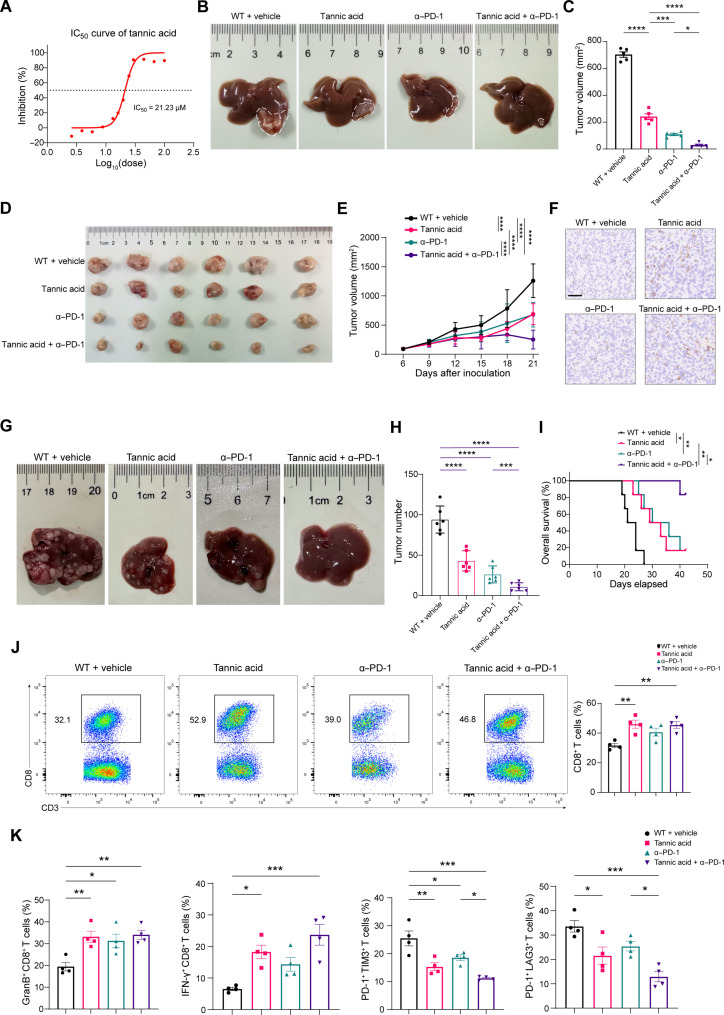
T cell exhaustion is a critical obstacle for durable treatment response in hepatocellular carcinoma (HCC). Developing drugs that control tumor growth and simultaneously bolster immune function is of great significance. Although high-mobility group box 2 (HMGB2) has been reported to be crucial to HCC prognosis, its role in the tumor microenvironment remains unclear. Here, we found HMGB2+ CD8+ T cells as being associated with immune exhaustion and resistance to anti-PD-1 treatment through single-cell RNA sequencing. Mechanistically, HMGB2 impaired the oxidative phosphorylation in CD8+ T cells and inactivated the interferon-γ response in tumor cells, reducing the antitumor effector function. Tannic acid, a specific inhibitor of HMGB2, synergized with PD-1 antibody to attenuate tumor growth and reverse T cell exhaustion. Our findings highlight the unique role of HMGB2 as an immune exhaustion associated molecule. Targeting HMGB2 on both CD8+ T cells and tumor cells contributed to promising treatment strategies for HCC.


Figures

Fig. 1.
Fig. 1.. Identification of HMGB2 as a novel negative regulator for T cell immunity.
(A) UMAP plot for the different subclusters of CD8+ T cells in human HCC tissues. (B) UMAP plots show marker genes in different CD8+ T clusters. (C) Heatmap shows cell markers in each CD8+ T subtype. (D) Volcano plot for differential expression analysis of TEX and TEFF clusters. Padj, adjusted P value; n.s., not significant. (E) Venn plot for differential genes between TEX and TEFF clusters in three scRNA-seq datasets and one bulk RNA-seq dataset. (F) Dot plot shows specific function markers enriched in different CD8+ T subclusters in Zhongshan cohort. (G) UMAP plot for the different subclusters of CD8+ T cells in GSE149614 dataset. TCM, central memory T cells. (H) Relative expression of HMGB2 in CD8+ T cells at different tumor stages. (I) Relative expression of HMGB2 in CD8+ T cells in the normal liver tissues and tumor tissues. (J) UMAP plot for the different subclusters of CD8+ T cells in GSE140228 dataset. (K) UMAP plot shows the expression of HMGB2 in different CD8+ T cell subclusters. (L) Relative expression of HMGB2 in CD8+ T cells in the normal liver tissues and tumor tissues. (M) UMAP plot for the different subclusters of CD8+ T cells in mouse HCC tissues. (N) UMAP plot shows Hmgb2 expression of CD8+ T cells in mouse HCC tissues. (O) Dot plot shows specific function markers enriched in CD8+ T subclusters of mouse HCC tissues. Wilcoxon test.
Fig. 2.
Fig. 2.. Hmgb2 deficiency enhances mitochondrial OXPHOS in CD8+ T cells.
(A) Gene Ontology (GO) analysis reveals changes in Hmgb2-cKO CD8+ T cells. FDR, false discovery rate. (B) Gene set enrichment analysis (GSEA) shows top pathway enriched in Hmgb2-cKO CD8+ T cells. (C) mRNA levels of electron transport chain genes in NC and Hmgb2-cKO CD8+ T cells. (D) Heatmap for energy metabolites in isolated NC and Hmgb2-cKO CD8+ T cells detected by liquid chromatography–MS (LC-MS) analysis. cAMP, adenosine 3′,5′-monophosphate; GTP, guanosine 5′-triphosphate; NAD, nicotinamide adenine dinucleotide; NADH, reduced form of NAD+; NADPH, reduced form of nicotinamide adenine dinucleotide phosphate; CoA, coenzyme A; AMP, adenosine 5′-monophosphate; UDP, uridine 5′-diphosphate; ADP, adenosine 5′-diphosphate; GDP, guanosine diphosphate; NADP, beta-nicotinamide adenine dinucleotide phosphoric acid. (E) Intensity of ATP, NAD+, and fumaric acid as in (D) (n = 3). (F) KEGG analysis shows top metabolic pathway changes as in (D). (G) Seahorse extracellular flux analysis of OCR in isolated NC and Hmgb2-cKO CD8+ T cells. FCCP, carbonyl cyanide p-trifluoromethoxyphenylhydrazone. (H) Quantification of OCR as in (G) (n = 32). (I) Immunofluorescence micrographs of NC and Hmgb2-cKO OT-I CD8+ T cells stained with MitoTracker (red) and 4′,6-diamidino-2-phenylindole (DAPI) (blue) after coculture with Hepa1-6–OVA cells. Scale bar, 10 μm. (J) Comparison of fluorescence of stained MitoTracker as in (I) (n = 5). (K) Transmission electron microscope images of mitochondria in activated NC and Hmgb2-cKO OT-I CD8+ T cells after coculture with Hepa1-6–OVA cells. The density of mitochondrial cristae is compared (n = 7). (L) Flow cytometry analysis of CD44hi CD62Llo effector CD8+ T cells in NC and Hmgb2-cKO OT-I CD8+ T cells after coculture with Hepa1-6–OVA cells (n = 4). (M) Flow cytometry analysis of GranB+ IFN-γ+ CD8+ T cells as in (L). (N) Flow cytometry analysis of TNF-α+ CD8+ T cells as in (L). (O) Flow cytometry analysis of PD1+ LAG-3+ CD8+ T cells as in (L). Data are presented as the means ± SEM. *P < 0.05; **P < 0.01; ***P < 0.001; ****P < 0.0001. Student’s t test for (C), (E), and (J) to (O). Two-way analysis of variance (ANOVA) test for (H).
Fig. 3.
Fig. 3.. HMGB2 regulated mitochondrial transcription through KEAP1/NRF2 pathway.
(A) Location of differential accessible ATAC-seq peaks in NC and Hmgb2-cKO CD8+ T cells. 3′UTR, 3′ untranslated region; 5′UTR, 5′ untranslated region. (B) Chromatin accessibility changes of genes associated with effector function and mitochondrial transcription factors. (C) The correlation between Hmgb2, Tfam, and Tfb1m expression in CD8+ T cells from murine scRNA-seq data. (D) mRNA levels of Keap1 and Nfe2l2 in NC and Hmgb2-cKO CD8+ T cells (n = 6). (E) mRNA levels of ARE genes in NC and Hmgb2-cKO CD8+ T cells (n = 3). (F) Protein changes of KEAP1 and NRF2 after Hmgb2 knockout. (G) The ubiquitination of NRF2 after Hmgb2 knockout. IB, immunoblot. (H) Protein changes of KEAP1 and NRF2 after stimulation of mouse recombinant HMGB2 protein and IN-1. NC CD8+ T cells were treated with recombinant HMGB2 protein (500 ng/ml) and/or IN-1 (10 μM) for 48 hours. (I) The ubiquitination of NRF2 after cell treatment as in (H). (J) Immunofluorescence staining of spontaneous HCC tissues in NC and Hmgb2-cKO mice. NRF2+ KEAP1 CD8+ T cells were labeled. Scale bars, 20 μm (left) and 10 μm (right). HP, high power field. (K) Seahorse extracellular flux analysis of OCR in different CD8+ T cell groups (n = 6 to 8) after cell treatment as in (H). (L) Quantification of seahorse extracellular flux analysis of OCR of different CD8+ T cells as in (K). Data are presented as the means ± SEM. *P < 0.05; **P < 0.01; ***P < 0.001; ****P < 0.0001. Pearson test for (C) Student’s t test for (D), (E), and (J). Two-way ANOVA test for (L).
Fig. 4.
Fig. 4.. HMGB2+ CD8+ T cells dampens antitumor immunity and immunotherapeutic response.
(A) UMAP plot for the different subclusters of CD8+ T cells in human HCC tissues scheduled to neoadjuvant anti–PD-1 monotherapy. (B) Histogram plot shows the proportions of CD8+ T cells as in (A). (C) UMAP plot for the HMGB2 expression of CD8+ T cells in nonresponse and PR HCC tissues. (D) Relative expression of HMGB2 in CD8+ T cells as in (C). (E) Comparison of HMGB2 expression in CD8+ T cells in pretreatment and postoperative tissues. (F) The schematic diagram shows the medication regimen in vivo. (G) Representative images of HCC spontaneous models in different treatment groups. Scale bar, 1 cm. (H) Tumor numbers of HCC spontaneous models as in (G). (I) Survival time of HCC spontaneous models as in (G). (J) Flow cytometry of intratumoral IFN-γ+ CD8+ T cells and GranB+ CD8+ T cells from spontaneous HCC tissues. (K) Quantification of intratumoral IFN-γ+ CD8+ T cells (n = 5). (L) Quantification of intratumoral GranB+ CD8+ T cells (n = 5). (M) Immunofluorescence staining of effector markers in spontaneous HCC tissues as in (G). Scale bar, 50 μm. Data are presented as the means ± SEM. *P < 0.05; **P < 0.01; ***P < 0.001; ****P < 0.0001. Wilcoxon test for (D) and (E). One-way ANOVA test for (H), (K), and (L). The icon in (F) is cited from BioRender: W. Qu (2025; https://BioRender.com/m63n001).
Fig. 5.
Fig. 5.. Hmgb2 knockdown enhanced IFN-γ response in HCC cells.
(A) Representative images of harvested Hepa1-6 subcutaneous HCC tumors. Scale bar, 1 cm (B) Tumor growth curves of Hepa1-6 subcutaneous tumors in BALB/C nude mice and C57BL/6J mice. (C) Tumor weights of subcutaneous Hepa1-6 tumors in BALB/C nude mice and C57BL/6J mice (n = 6). (D) Difference of tumor volumes between shCtrl and shHmgb2 subcutaneous tumors in BALB/C nude mice and C57BL/6J mice (n = 6). (E) Differential GO pathways in Hepa1-6 shHmgb2 cells. JAK, Janus kinase. (F) GSEA analysis shows top pathway enriched in Hepa1-6 shHmgb2 cells. (G) Western blotting experiment shows STAT1 pathway changes in Hepa1-6 cells and Huh7 cells. Cells were treated with IFN-γ (10 ng/ml) or fludarabine (10 μM) for 24 hours. (H) Annexin V apoptosis analysis for Hepa1-6 cells treated with vehicle and IFN-γ (10 or 20 ng/ml). PI, propidium iodide. (I) Quantification for proportions of apoptotic cells after treatment of IFN-γ. (J) T cell killing assay with Hepa1-6 shCtrl and shHmgb2 cells and wild-type (WT) CD8+ T cells (n = 5). RLU, relative light unit. (K) Terminal deoxynucleotidyl transferase–mediated deoxyuridine triphosphate nick end labeling (TUNEL) staining and quantification of Hepa1-6 subcutaneous tumors (n = 4). Scale bar, 25 μm. HPF, high power field. (L) Representative immunohistochemistry images of CD8, IFN-γ, and CXCL10 staining in Hepa1-6 subcutaneous tumors. Scale bars, 20 μm. (M) Quantification of CD8, IFN-γ, and CXCL10 staining in Hepa1-6 subcutaneous tumors (n = 4). Data are presented as the means ± SEM. *P < 0.05; **P < 0.01; ***P < 0.001. Two-way ANOVA test for (B) Student’s t test for (C), (D), (I), (J), (K), and (M).
Fig. 6.
Fig. 6.. HMGB2 impaired antitumor immunity through Trim24/Stat1 signal.
(A) ChIP assay shows the interaction of HMGB2 with Stat1 chromatin (n = 3). (B) Colocalization of HMGB2, STAT1 and TRIM 24 in HCC subcutaneous tumor tissue. Scale bar, 10 μm. (C) CoIP assay shows the interaction of HMGB2 and TRIM24. (D) ChIP-PCR shows that TRIM24 modulates the transcriptional level of Stat1 (n = 3). (E) Luciferase reporter assay shows that the Trim24/Hmgb2 signal modulates the transcriptional level of Stat1 (n = 3). OE, overexpression. (F) Representative images of the orthotopic HCC models. (G) Tumor weights of different groups from the orthotopic HCC models (n = 6). (H) Overall survival of different treatment groups from the orthotopic HCC models. (I) Flow cytometry of intratumoral CD3+ CD8+ T cells as in (G). (J) Flow cytometry of intratumoral effector markers as in (G). (K) Quantification of intratumoral IFN-γ+ CD8+ T cells and GranB+ CD8+ T cells in different treatment groups (n = 5). Data are presented as the means ± SEM. *P < 0.05; **P < 0.01; ***P < 0.001; ****P < 0.0001. Student’s t test for (A) and (D). One-way ANOVA test for (E), (G), and (K).
Fig. 7.
Fig. 7.. Tannic acid synergizes with anti–PD-1 immunotherapy.
(A) Proliferative inhibition curve for tannic acid on Hepa1-6 cells. IC50 = 21.23 μM. (B) Representative images of orthotopic HCC models. (C) Tumor volumes of different groups from the orthotopic HCC model (n = 6). (D) Representative images of colorectal subcutaneous tumors constructed by MC38 cell injection (n = 6). (E) Tumor growth curves of subcutaneous tumors constructed by MC38 cell injection (n = 6). (F) Immunohistochemistry staining images of CD8 in the subcutaneous tumors constructed by MC38 cell injection. Scale bar, 50 μm. (G) Representative images of spontaneous HCC model. (H) Tumor weights of different treatment groups in the spontaneous HCC model (n = 6). (I) Overall survival of different treatment groups in the spontaneous HCC model (n = 6). (J) Flow cytometry and quantification of intratumoral CD3+ CD8+ T cells as in (H). (K) Quantification of flow cytometry analysis on intratumoral effector CD8+ T cells and exhausted CD8+ T cells as in (H). Data are presented as the means ± SEM. *P < 0.05; **P < 0.01; ***P < 0.001; ****P < 0.0001. One-way ANOVA test for (C), (H), (J), and (K). Two-way ANOVA test for (E).

References

    1. Sung H., Ferlay J., Siegel R. L., Laversanne M., Soerjomataram I., Jemal A., Bray F., Global cancer statistics 2020: GLOBOCAN estimates of incidence and mortality worldwide for 36 cancers in 185 countries. CA Cancer J. Clin. 71, 209–249 (2021). - PubMed
    1. Llovet J. M., Kelley R. K., Villanueva A., Singal A. G., Pikarsky E., Roayaie S., Lencioni R., Koike K., Zucman-Rossi J., Finn R. S., Hepatocellular carcinoma. Nat. Rev. Dis. Primers 7, 6 (2021). - PubMed
    1. Llovet J. M., Pinyol R., Kelley R. K., El-Khoueiry A., Reeves H. L., Wang X. W., Gores G. J., Villanueva A., Molecular pathogenesis and systemic therapies for hepatocellular carcinoma. Nat. Cancer 3, 386–401 (2022). - PMC - PubMed
    1. Bagchi S., Yuan R., Engleman E. G., Immune checkpoint inhibitors for the treatment of cancer: Clinical impact and mechanisms of response and resistance. Annu. Rev. Pathol. 16, 223–249 (2021). - PubMed
    1. O’Donnell J. S., Teng M. W. L., Smyth M. J., Cancer immunoediting and resistance to T cell-based immunotherapy. Nat. Rev. Clin. Oncol. 16, 151–167 (2019). - PubMed

MeSH terms