. 2025 May 2;11(18):eadq5439.
doi: 10.1126/sciadv.adq5439. Epub 2025 May 2.

Taxonomically distinct diatom viruses differentially impact microbial processing of organic matter

Affiliations

Taxonomically distinct diatom viruses differentially impact microbial processing of organic matter

Chana F Kranzler et al. Sci Adv. .

Abstract

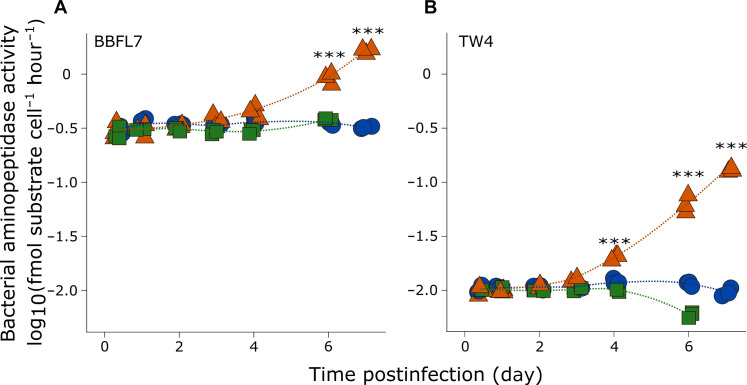
Phytoplankton viruses facilitate the production of dissolved organic matter (DOM) through host lysis, shaping DOM composition, and subsequent regenerative processing. We explored how DOM generated from a bloom-forming, centric diatom, infected with taxonomically distinct viruses-a single-stranded (ss) DNA and a ssRNA virus-impacted microbial processing of organic matter. DOM derived from uninfected and ssDNA virus-infected cultures supported growth in bacterial isolates and a mixed assemblage. In contrast, DOM from ssRNA virus infection did not stimulate growth, but rather induced ectoproteolytic activity, suggesting this DOM was less bioavailable. Exoprotease activity was also substantially higher in ssRNA virus-infected cellular exudates compared to ssDNA virus-infected and uninfected cultures. This suggests that DOM produced through virus-mediated host lysis does not a priori support secondary production and implicate ssRNA virus infection as a source of proteolytic activity in the water column, highlighting a multifaceted role for viruses in altering microbial utilization and remineralization length scales of organic matter in the ocean.


Figures

Fig. 1.
Fig. 1.. Host-virus infection dynamics in C. tenuissimus and sample collection.
(A) Host abundance (in cells per milliliter) and (B) photosynthetic efficiency (Fv/Fm) in uninfected cultures (blue circles) and those infected with CtenRNAV (orange triangles) or CtenDNAV (green squares). Biological triplicates are plotted with a line depicting a local polynomial regression (LOESS). (C) Cultures were fractionated into extracellular DOM (eDOM, <0.22 μm) and biomass (>1.2 μm) samples by filtration. Biomass was further partitioned into particulate and intracellular DOM (iDOM) using freeze-thaw sonication cycles and centrifugation (see the Materials and Methods). Created in BioRender by C. Kranzler (2024; https://BioRender.com/yp73w5l).
Fig. 2.
Fig. 2.. Bacterial response to diatom-derived eDOM generated during viral infection.
Specific growth rates (μ; per day) of (A) BBFL7 (B) Tw4, and (C) a coastal bacterial assemblage (mixed) following incubation with eDOM collected from uninfected (Ctrl; blue), CtenRNAV-infected (orange), and CtenDNAV-infected (green) C. tenuissimus cultures or FSW (gray). Mean and SE of triplicate incubations are shown along with individual replicates (diamonds). Data are representative of two to three independent experiments. Cell-specific aminopeptidase activity (in femtomoles of substrate hydrolyzed per cell per hour) in (D) BBFL7, (E) Tw4, and (F) a coastal bacterial assemblage upon exposure to eDOM fractions from Ctrl, CtenRNAV-, and CtenDNAV-infected cultures. Color scale denotes time postinfection (in days) of eDOM sample collection throughout each experiment. Boxes depict median (line), upper, and lower quartiles; whiskers denote values 1.5× the interquartile range. Two-way analysis of variance (ANOVA) (A and B) and ANOVA (C to F) with Tukey’s post hoc test for pairwise comparison, ***P < 0.001, **P < 0.01, and *P < 0.05. See table S1 for a summary of statistical analyses.
Fig. 3.
Fig. 3.. Bacterial ectoproteolytic activity in response to iDOM generated during virus infection.
Cell-specific aminopeptidase activity (in femtomoles of substrate hydrolyzed per cell per hour) in (A) BBFL7 and (B) Tw4 upon exposure to iDOM collected from uninfected C. tenuissimus cultures (blue circles) and cultures infected with CtenRNAV (orange triangles) and CtenDNAV (green squares) throughout the time course of viral infection. Biological triplicates are plotted with a line depicting a local polynomial regression (LOESS).Two-way ANOVA with Tukey’s post hoc test for pairwise comparison, ***P < 0.001. Data are representative of two to three independent experiments. See table S1 for a summary of statistical analyses.
Fig. 4.
Fig. 4.. Protease activity in C. tenuissimus during virus infection.
(A) Intracellular aminopeptidase activity (in nanomoles of substrate hydrolyzed per hour per microgram of protein) in C. tenuissimus iDOM samples collected throughout a time course of infection with CtenRNAV (orange triangles) and CtenDNAV (green squares) compared with uninfected (Ctrl) cultures (blue circles). Biological triplicates are plotted with a line depicting a local polynomial regression (LOESS).Two-way ANOVA, Tukey’s post hoc test, ***P < 0.001. (B) Free, dissolved, extracellular aminopeptidase activity (in micromolar of substrate hydrolyzed per hour) measured in cellular exudates (eDOM; <0.22 μm) collected from C. tenuissimus infected with CtenRNAV and CtenDNAV compared to uninfected cultures (Ctrl). Boxes depict median (line), upper, and lower quartiles; whiskers denote values 1.5× the interquartile range. ANOVA, Tukey’s post hoc test, ***P < 0.001 and *P < 0.05. (C) Relationship between intracellular and extracellular aminopeptidase activities (in micromolar of substrate hydrolyzed per hour) measured in Ctrl (left), CtenRNAV (middle), and CtenDNAV (right) treatments. Color scale in (B) and (C) denotes time of sample collection throughout each infection experiment. Line of the best fit with 95% confidence intervals (gray shading) shown describing linear regression analysis with r2 and P values depicted for each fit. See table S1 for summary of statistical analyses.
Fig. 5.
Fig. 5.. Conceptual model of diatom virus-specific impacts on microbial processing and remineralization length scales.
Virus infection and virus-mediated host lysis in diatoms lead to the release of virus-specific DOM via the viral shunt. The DOM pool generated by ssDNA virus infection (left side, in green) directly supports microbial growth, fueling secondary production. In contrast, DOM derived from ssRNA virus infection (right side, in orange) is not readily available and temporally decouples the viral shunt from microbial production. Enhanced proteolytic activity (pac-man symbols) in response to ssRNA virus infection differentially affects the breakdown of particulate organic matter (POM), leading to an increase in (1) regenerated nitrogen, reducing the f-ratio, and (2) silica dissolution, increasing D:P, ultimately shortening the remineralization length scale (RLS) of particulate material as compared to ssDNA virus infection (downward background arrows). Proteolytic cleavage of DOM may eventually support secondary production or could end up in the recalcitrant pool fueling the microbial carbon pump. The lack of stimulation in enzymatic activity in response to ssDNA virus infection would limit the availability of regenerated nitrogen and silicon, increasing the f-ratio (1) and decreasing D:P (2), respectively. The relationship of the RLS to the mixed layer depth (MLD; dashed horizontal line) will ultimately determine the relative coupling of viruses to recycling (shunt) and export (shuttle). Created in BioRender by C. Kranzler (2024; https://BioRender.com/qlk4ies).

References

    1. Field C. B., Behrenfeld M. J., Randerson J. T., Falkowski P., Primary production of the biosphere: Integrating terrestrial and oceanic components. Science 281, 237–240 (1998). - PubMed
    1. C. A. Carlson, D. A. Hansell, “Chapter 3 - DOM sources, sinks, reactivity, and budgets” in Biogeochemistry of Marine Dissolved Organic Matter (Academic Press, 2014), pp. 65–126.
    1. D. J. Repeta, “Chapter 2 - Chemical characterization and cycling of dissolved organic matter” in Biogeochemistry of Marine Dissolved Organic Matter (Academic Press, 2014), pp. 21–63.
    1. Moran M. A., Kujawinski E. B., Stubbins A., Fatland R., Aluwihare L. I., Buchan A., Crump B. C., Dorrestein P. C., Dyhrman S. T., Hess N. J., Howe B., Longnecker K., Medeiros P. M., Niggemann J., Obernosterer I., Repeta D. J., Waldbauer J. R., Deciphering ocean carbon in a changing world. Proc. Natl. Acad. Sci. U.S.A. 113, 3143–3151 (2016). - PMC - PubMed
    1. Buchan A., LeCleir G. R., Gulvik C. A., González J. M., Master recyclers: Features and functions of bacteria associated with phytoplankton blooms. Nat. Rev. Microbiol. 12, 686–698 (2014). - PubMed

Substances

LinkOut - more resources