. 2025 Jul 3;34(14):1184-1203.
doi: 10.1093/hmg/ddaf062.

The modifying effect of mutant LRRK2 on mutant GBA1-associated Parkinson disease

Affiliations

The modifying effect of mutant LRRK2 on mutant GBA1-associated Parkinson disease

Vera Serebryany-Piavsky et al. Hum Mol Genet. .

Erratum in

Abstract

Parkinson disease (PD) is the second most common neurodegenerative disease. While most cases are sporadic, in ~ 5%-10% of PD patients the disease is caused by mutations in several genes, among them GBA1 (glucocerebrosidase beta 1) and LRRK2 (leucine-rich repeat kinase 2), both prevalent among the Ashkenazi Jewish population. LRRK2-associated PD tends to be milder than GBA1-associated PD. Several recent clinical studies have suggested that carriers of both GBA1 and LRRK2 mutations develop milder PD compared to that observed among GBA1 carriers. These findings strongly suggested an interplay between the two genes in the development and progression of PD. In the present study Drosophila was employed as a model to investigate the impact of mutations in the LRRK2 gene on mutant GBA1-associated PD. Our results strongly indicated that flies expressing both mutant genes exhibited milder parkinsonian signs compared to the disease developed in flies expressing only a GBA1 mutation. This was corroborated by a decrease in the ER stress response, increase in the number of dopaminergic cells, elevated levels of tyrosine hydroxylase, reduced neuroinflammation, improved locomotion and extended survival. Furthermore, a significant decrease in the steady-state levels of mutant GBA1-encoded GCase was observed in the presence of mutant LRRK2, strongly implying a role for mutant LRRK2 in degradation of mutant GCase.

Keywords: Drosophila; GBA1; LRRK2; Parkinson disease.


Figures

Figure 1
Figure 1
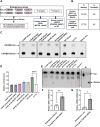
GCase activity and GlcCer (glucosylceramide) in transgenic flies. (A) Schematic representation of the regions on fly chromosome 3, which contains the two GBA1 orthologs (Gba1a, Gba1b) and the LRRK2 ortholog (LRRK). The transgenes are either: Mutant human GBA1, mutant human LRRK2 or both together. The human GBA1 variants include: N370S, L444P. The human LRRK2 variants include: I2020T, G2019S. WT LRRK2 expressing flies were also used. (B) a table summarizing amino acid identity and similarity of GBA1 and LRRK2 between human and drosophila (UniProt). (C) a TLC plate presenting activity assay of GCase as measured in lysates prepared from 2-days old flies. The value obtained from Gba1bm/m flies was considered as background [71] and subtracted from all other samples. (D) Average GCase activity of flies expressing L444P GCase (grey bars), L444P GCase and G2019S LRRK2 (purple bars), L444P GCase and I2020T LRRK2 (pink bars), N370S GCase (blue bars), N370S GCase and G2019S LRRK2 (brown bars), WT GCase (green bars) and w1118 (clear bars). The results are the mean ± SEM of three independent experiments. One-way ANOVA was used to calculate the significance of the results (F [6, 22] = 4.152, P = 0.0061). (E) TLC plate showing no GlcCer accumulation in 12-days old flies in comparison to its accumulation in Gba1bm/m flies. St.—Standards. Expression was under a Da-GAL4 driver. (F) mRNA level of GBA1 (grey bar) and endogenous fly Gba1b (clear bar) were evaluated using quantitative RT-PCR analysis in flies expressing mutant human GBA1. The results are the mean ± SEM of three independent experiments. Paired student’s t-test was used to calculate the significance of the results (p = 0.0052). (G) mRNA level of LRRK2 (grey bar) and endogenous fly LRRK (clear bar) were evaluated using quantitative RT-PCR analysis in flies expressing mutant human LRRK2. The results are the mean ± SEM of three independent experiments. Paired student’s t-test was used to calculate the significance of the results (P = 0.0274).
Figure 2
Figure 2
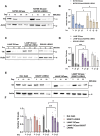
UPR parameters are decreased in flies co-expressing mGBA1 and mLRRK2. mRNA levels of UPR markers (a,E) sXbp1, (B,F) Hsc-70-3, (C,G) Atf4 and (D,H) Atf6 in whole flies at days 2, 12 and 22 post-eclosion, expressing N370S GCase (blue bars), N370S GCase and G2019S LRRK2 (brown bars), G2019S LRRK2 (white bars), as well as L444P GCase (grey bars), L444P GCase and G2019S LRRK2 (purple bars), L444P GCase and I2020T LRRK2 (pink bars), I2020T LRRK2 (orange bars), were analyzed by qRT-PCR. Expression was under a Da-GAL4 driver. The results are the mean ± SEM of three independent experiments. Two-way ANOVA was used to calculate significance of the results: * < 0.05, ** < 0.01, *** < 0.001, **** < 0.0001.
Figure 3
Figure 3
Phosphorylation of eIF2α is decreased in flies co-expressing mGBA1 and mLRRK2. A protein lysates, prepared from 10 flies at days 2 and 22 post-eclosion, expressing either L444P GCase (grey bars) or L444P GCase and I2020T LRRK2 (pink bars), were subjected to SDS-PAGE and western blotting. Expression was under a Da-GAL4 driver. The corresponding blots were interacted with anti-phospho-eIF2α antibodies. As a loading control, the blots were interacted with anti-eIF2α antibodies. B intensities of the corresponding bands as shown in (A) were quantified by densitometry and the p-eIF2α amount was divided by that of eIF2α at the same lane. The value obtained for 22-days old double mutant flies was considered 1 (paired student’s t-test, p = 0.0324). The results are the mean ± SEM of three independent experiments. C same as (A), using flies expressing either L444P GCase (grey bars) or L444P GCase and G2019S LRRK2 (purple bars). D intensities of the corresponding bands as shown in (C) were quantified by densitometry and the amount of p-eIF2α was divided by that of eIF2α at the same lane. The value obtained for 22-days old double mutant flies was considered 1 (paired student’s t-test, p = 0.0159). The results are the mean ± SEM of three independent experiments.
Figure 4
Figure 4
Degeneration of dopaminergic neurons is ameliorated in flies co-expressing mGBA1 and mLRRK2. (A) Maximum intensity projection of 175 102;172 139 (left to right; top to bottom, respectively, 0.5 μm), confocal sections through the central brain of adult drosophila carrying L444P GCase and of flies carrying both L444P GCase and G2019S LRRK2 mutations, following their staining with anti-TH antibodies, at the ages of 2- and 22-days post-eclosion. (B) Schematic representation of dopaminergic neuronal clusters in the adult drosophila brain, according to Casture et al. [125] (C-E) quantification of the anti-TH signal intensity obtained from the brains described above (A), of flies carrying L444P GCase (grey bars) and of flies carrying both L444P GCase and G2019S LRRK2 mutations (purple bars). The results represent the mean ± SEM of 5–10 brains, in the clusters: Protocerebral anterior median (PAM, C), protocerebralmedial 1/2 (PPM1/2, D), and protocerebralanterior lateral 1 (PPL1, E). The clusters: Tritocerebral (T) and subesophageal (SOG) were not included. Paired student’s t-test, with Bonferroni-Dunn correction for multiple comparisons, was used to calculate the significance of the results. Significance: * < 0.05, ** < 0.01.
Figure 5
Figure 5
TH levels are higher in flies co-expressing mGBA1 and mLRRK2. (A) Protein lysates were prepared from heads of 10 flies at days 2, 12 and 22 post-eclosion, expressing either N370S GBA1 (blue bars) or N370S GBA1 and G2019S LRRK2 (brown bars), and subjected to western blotting. The corresponding blots were interacted with anti-TH antibodies. As a loading control, the blots were interacted with anti-actin antibody. Expression was under a Ddc-GAL4 driver. (B) Intensities of the corresponding bands as presented in (A) were quantified by densitometry and the TH amount was divided by that of actin at the same lane. The value obtained for 2-days old flies for each genotype was considered 1. The results are the mean ± SEM of four independent experiments. Two-way ANOVA analysis was used to calculate the significance of the results (day 12 p = 0.0455, day 22 p = 0.0332). (C) the same as (A), using flies expressing either L444P GBA1 (grey bars), G2019S LRRK2 (white bars) or both L444P GBA1 and G2019S LRRK2 (purple bars). (D) Intensities of the corresponding bands as presented in (C) were quantified by densitometry and the TH amount was divided by that of actin at the same lane. The value obtained for 2-days old flies for each genotype was considered 1. The results are the mean ± SEM of four independent experiments. Two-way ANOVA analysis was used to calculate the significance of the results (day 12 p < 0.001, day 22 p = 0.04). (E) the same as (A), using flies expressing Ddc-Gal4 (clear bars), I2020T LRRK2 (pink bars), and either L444P GBA1 (grey bars) or L444P GBA1 and I2020T LRRK2 (purple bars). (F) Intensities of the corresponding bands as presented in (E) were quantified by densitometry and the TH amount was divided by that of actin at the same lane. The value obtained for 2-days old flies for each genotype was considered 1. The results are the mean ± SEM of three independent experiments. Two-way ANOVA analysis was used to calculate the significance of the results (day 12 p = 0.0011, day 22 p = 0.0466).
Figure 6
Figure 6
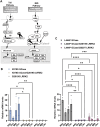
Neuroinflammation is decreased in flies co-expressing mGBA1 and mLRRK2. (A) Schematic representation of the IMD and the Toll innate immunity pathways in Drosophila [71]. (B) mRNA levels of Attacin-C (ATTC), Drosomycin (Drs), Metchnikowin (Mtk) and Cecropin (Cec) in heads of flies at day 22 post-eclosion, expressing N370S GCase (blue bars), N370S GCase and G2019S LRRK2 (brown bars), G2019S LRRK2 (white bars), were analyzed by qRT-PCR. Expression was under a Ddc-GAL4 driver. The results are the mean ± SEM of three independent experiments. (C) Same as B, for L444P GCase (grey bars), L444P GCase and G2019S LRRK2 (purple bars) and L444P GCase and I2020T LRRK2 (pink bars) flies. Two-way ANOVA was used to calculate the significance of the results: * < 0.05, ** < 0.01, *** < 0.001, **** < 0.0001.
Figure 7
Figure 7
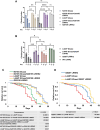
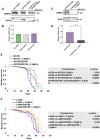
Locomotion and survival are improved in flies co-expressing mGBA1 and mLRRK2. (A) Thirty flies expressing either single mutant GBA1 (N370S (blue bars) or L444P (grey bars)), or single G2019S LRRK2 (white bars) or both mutant GBA1 and mutant G2019S LRRK2 (brown and purple bars for N370S and L444P, respectively) were analyzed for locomotion behavior at days 2, 12 and 22 post-eclosion. Expression was under a Ddc-GAL4 driver. The value obtained for 2-days old flies for each genotype was considered 1. The results are the mean ± SEM of five independent experiments. Two-way ANOVA was used to calculate the significance of the results (N370S: Day 12 p = 0.0099, day 22 p = 0.0022; L444P: Day 12 p < 0.0001, day 22 p < 0.0001). (B) Same as (A), using flies expressing L444P GBA1 (grey bars), I2020T LRRK2 (pink bars), WT LRRK2 (green bars) or both L444P GBA1 and G2019S LRRK2 (purple bars). The results are the mean ± SEM of five independent experiments. Two-way ANOVA was used to calculate the significance of the results (day 12 p = 0.0006, day 22 p = 0.0385). (C) Kaplan Meier curve showing the overall survival rates of flies expressing either single mutant GBA1 (N370S (green line) or L444P (red line)), single mutant G2019S LRRK2 (blue line) or both mutant GBA1 and mutant G2019S LRRK2 (orange and yellow lines for N370S and L444P, respectively). (D) Same as (C), using flies expressing L444P GBA1 (red line), I2020T LRRK2 (blue line) or both (yellow line).
Figure 8
Figure 8
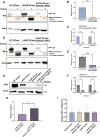
The presence of active LRRK2 is essential for its positive effect on mGCase. (A) Protein lysates were prepared from 10 flies expressing different human LRRK2 variants (WT LRRK2 (green bar), G2019S LRRK2 (white bar), and L444P GCase/G2019S LRRK2 (purple bar)) and subjected to 6% SDS-PAGE and western blotting. The corresponding blots were interacted with anti-LRRK2 antibodies. As a loading control, the blots were interacted with anti-actin antibody. Expression was under a Da-GAL4 driver. (B) Intensities of the corresponding bands as presented in (A) were quantified by densitometry and the LRRK2 amount was divided by that of actin at the same lane. The value obtained for WT LRRK2 flies was considered 1. The results are the mean ± SEM of three independent experiments. One-way ANOVA analysis was used to calculate the significance of the results. (C) Protein lysates were prepared from 10 flies expressing L444P GCase/G2019S LRRK2, treated (hatched bar) or untreated (purple bar) with 2.5 μM LRRK2-IN-1, and subjected to 6% SDS-PAGE and western blotting. The corresponding blots were interacted with anti-LRRK2 antibodies. As a loading control, the blots were interacted with anti-actin antibody. Expression was under a Da-GAL4 driver. (D) Intensities of the corresponding bands as presented in (C) were quantified by densitometry and the LRRK2 amount was divided by that of actin at the same lane. The value obtained for untreated flies was considered 1. The results are the mean ± SEM of three independent experiments. Unpaired student’s t-test analysis was used to calculate the significance of the results (p = 0.0283). (E) Kaplan Meier curve showing the overall survival rates of flies expressing either N370S GBA1 grown with (purple line) or without (green line) 2.5 μM LRRK2-IN-1, as well as N370S GBA1 with G2019S LRRK2 grown with (blue line) or without (orange line) 2.5 μM LRRK2-IN. (F) Kaplan Meier curve showing the overall survival rates of flies expressing either L444P GBA1 grown with (purple line) or without (red line) 2.5 μM LRRK2-IN-1, as well as L444P GBA1 with G2019S LRRK2 grown with (blue line) or without (yellow line) 2.5 μM LRRK2-IN.
Figure 9
Figure 9
The steady state level of mGCase reduces in the presence of mLRRK2. (A) Protein lysates were prepared from 10 flies expressing the human WT GCase, N370S GCase (blue bar), and both N370S GCase and G2019S LRRK2 (brown bar) at 2-days post-eclosion. Samples were subjected to overnight endoH digestion, western blotting and the corresponding blots were interacted with anti-myc antibody. As a loading control, the blots were interacted with anti-actin antibody. (B) Intensities of the corresponding bands in the untreated lanes as shown in (A) were quantified by densitometry and GCase amount was divided by that of actin at the same lane. The value obtained for untreated N370S GCase was considered 1. The results are the mean ± SEM of three independent experiments (paired student’s t-test: P = 0.0081). (C) Same as (B), summarizing myc level in different cellular fractions, as shown in (A). The results are the mean ± SEM of three independent experiments. Two-way ANOVA analysis was used to calculate the significance of the results (ER P = 0.0067, lysosomal P = 0.0057). (D) Same as (A), using the L444P GCase variant, with (purple bar) and without (grey bar) mLRRK2. (E) Same as (B), quantifying the blot shown in (D). The value obtained for untreated L444P GCase was considered 1. The results are the mean ± SEM of four independent experiments (paired student’s t-test: P < 0.0001). (F) Same as (E), summarizing myc level in different cellular fractions, as shown in (D). The results are the mean ± SEM of three independent experiments. Two-way ANOVA analysis was used to calculate the significance of the results (ER P = 0.0107, lysosomal P = 0.0082) (G) protein lysates were prepared from 22-days post-eclosion flies expressing either WT GCase, L444P GCase or from double mutant flies L444P GCase/G2019S LRRK2 flies with or without 2.5 μM of LRRK2-IN treatment. Lysates were subjected to western blotting and the corresponding blots were interacted with anti-myc antibody. As a loading control, the blots were interacted with anti-actin antibody. Expression was under a Da-GAL4 driver. (H) Intensities of double mutant flies with (hatched bar) and without (purple bar) treatment corresponding bands as shown in (E) were quantified by densitometry and GCase amount was divided by that of actin at the same lane. The value obtained for double mutant untreated flies was considered 1. The results are the mean ± SEM of three independent experiments (paired student’s t-test: P = 0.0454). I mRNA levels of GBA1 in flies expressing either mutant GBA1 (blue and grey bars) or both mutant GBA1 and LRRK2 (brown and purple bars) were analyzed by qRT-PCR. The results are the mean ± SEM of three independent experiments. One-way ANOVA was used to calculate the significance of the result. Expression was under a Ddc-GAL4 driver.

Similar articles

References

    1. Poewe W, Seppi K, Tanner CM. et al. Parkinson disease. Nat Rev Dis Primer 2017;3:17013. - PubMed
    1. Dauer W, Przedborski S. Parkinson’s disease: mechanisms and models. Neuron 2003;39:889–909. - PubMed
    1. Houlden H, Singleton AB. The genetics and neuropathology of Parkinson’s disease. Acta Neuropathol (Berl) 2012;124:325–338. - PMC - PubMed
    1. Stefanis L. Α-Synuclein in Parkinson’s disease. Cold Spring Harb Perspect Med 2012;2:a009399. - PMC - PubMed
    1. Jankovic J. Parkinson’s disease: clinical features and diagnosis. J Neurol Neurosurg Psychiatry 2008;79:368–376. - PubMed

MeSH terms

Substances