. 2025 Jun 20;43(18):2069-2083.
doi: 10.1200/JCO-24-02394. Epub 2025 May 2.

Characterization and Clinical Implications of p53 Dysfunction in Patients With Myelodysplastic Syndromes

Collaborators, Affiliations

Characterization and Clinical Implications of p53 Dysfunction in Patients With Myelodysplastic Syndromes

Matteo Zampini et al. J Clin Oncol. .

Abstract

Purpose: Tumor Protein 53 (p53) expressed from gene TP53 is a seminal tumor suppressor. We aimed to characterize mutational and nonmutational mechanisms of p53 dysfunction in myelodysplastic syndromes (MDS) and to investigate their clinical effect.

Patients and methods: We analyzed a cohort of 6,204 patients with MDS and subsets of patients with available information on RNA sequencing of tumor cells (n = 109), high-dimensional phenotype of immune cells (n = 77), and multiomics analysis (RNA sequencing and proteomics) on single cells (n = 15). An independent validation was performed on 914 patients.

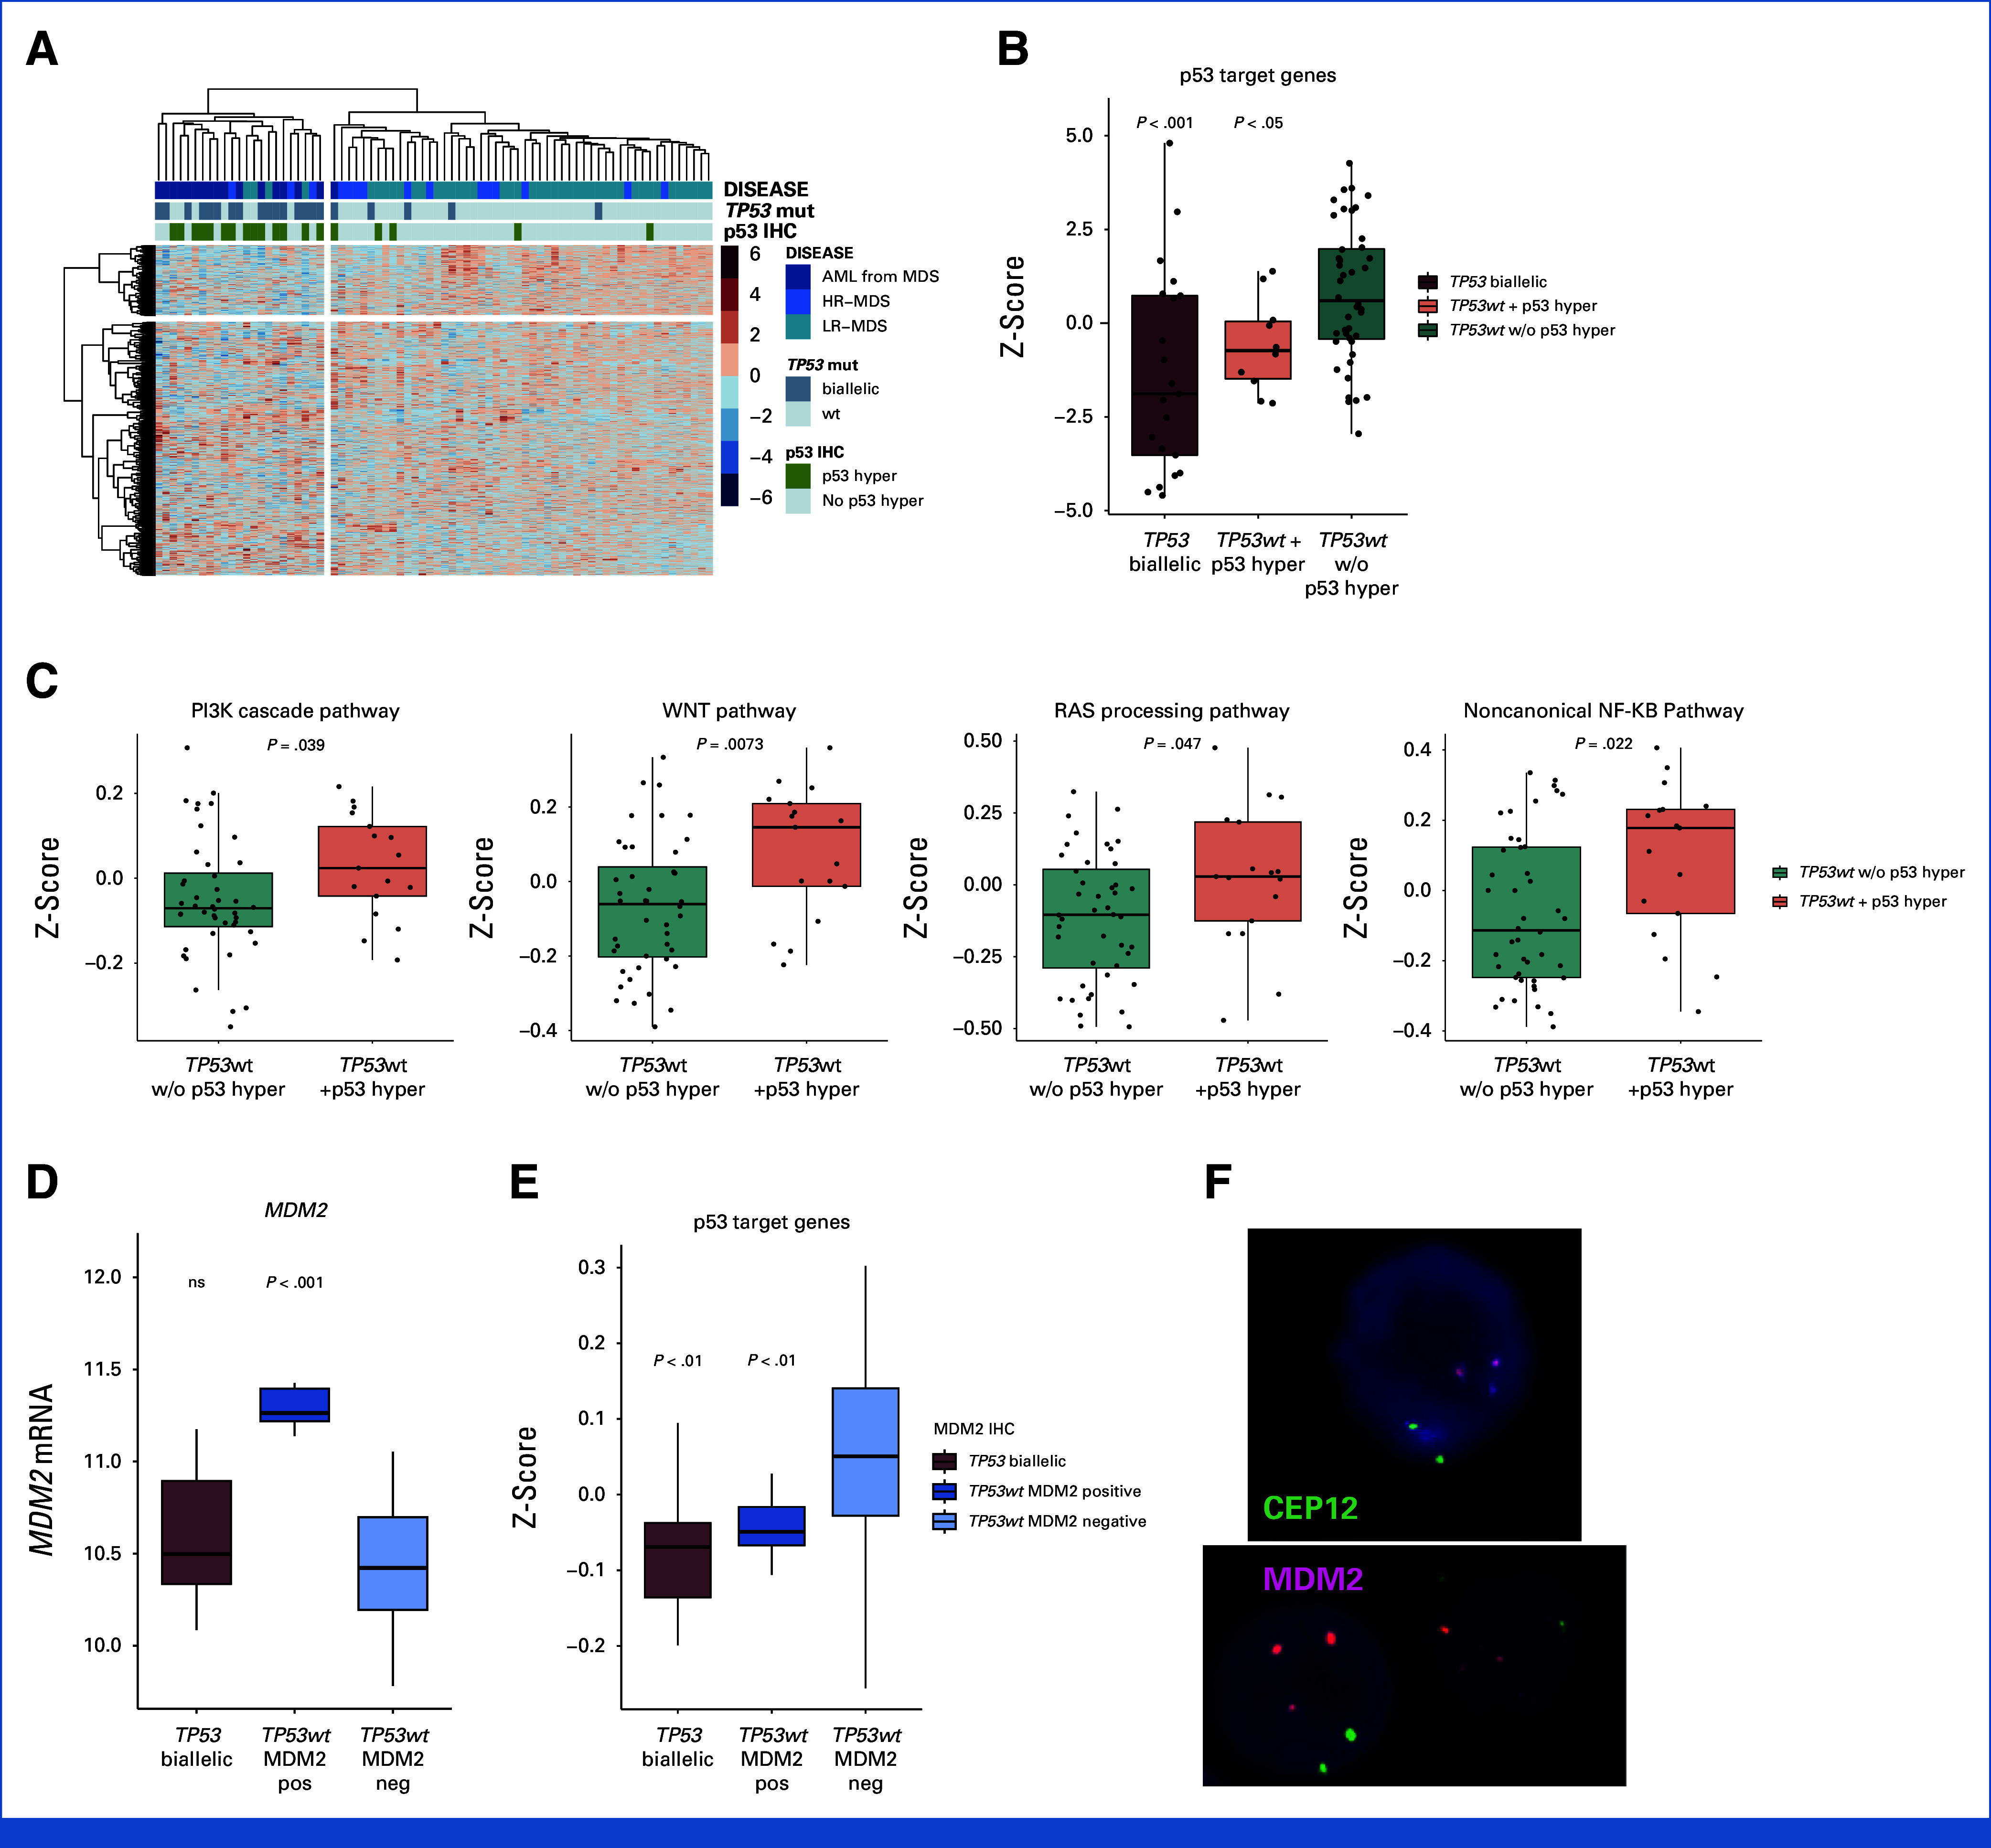
Results: Biallelic TP53 inactivation was a powerful driver of disease progression and identified high-risk patients, regardless of variant allele frequency. Monoallelic and biallelic inactivation represent disease stages occurring as a multihit process in MDS with TP53 mutations, thus potentially refining the optimal timing of therapeutic interventions in these patients. We identified a subset of MDS (5%) characterized by TP53 wild-type and hyperexpression of abnormal p53 protein in bone marrow progenitors that exhibit dismal outcome. These patients presented upstream p53 signaling aberrations in Pi3K cascade; RAS, WNT, and NF-KB pathways; and MDM2 gene amplification, together with a downstream dysregulation of p53 targets. MDS with p53 dysfunction displayed a distinct immune dysregulation involving myeloid-derived inflammation and impaired antigen presentation, which may be a driver of their poor prognosis and provide the groundwork for innovative immunotherapies.

Conclusion: The identification of nonmutational p53 dysfunction in MDS may lay the foundation for a mechanistic classification of myeloid neoplasms, moving beyond a purely molecular stratification. The recognition of patients with p53 dysfunction is relevant to provide correct disease-risk assessment and interventions, as well as to refine the design of clinical trials.


Conflict of interest statement

The following represents disclosure information provided by authors of this manuscript. All relationships are considered compensated unless otherwise noted. Relationships are self-held unless noted. I = Immediate Family Member, Inst = My Institution. Relationships may not relate to the subject matter of this manuscript. For more information about ASCO's conflict of interest policy, please refer to www.asco.org/rwc or ascopubs.org/jco/authors/author-center.

Open Payments is a public database containing information reported by companies about payments made to US-licensed physicians (Open Payments).

Figures

FIG 1.
FIG 1.
Clinical outcome of the study population stratified by TP53 status (wt, mono- and biallelic TP53 inactivation, plot A-F) and by p53 expression in bone marrow progenitors (plot G-M). HMA, hypomethylating agents; HSCT, allogenic stem cell transplantation; OS, overall survival; wt, wild-type.
FIG 2.
FIG 2.
Landscape of transcriptomic regulation in patients with MDS (n = 109) according to TP53 mutational status and/or p53 hyperexpression. (A) Heat map depicting unsupervised clustering using top 2,000 most variable genes identified by RNA sequencing. (B, C) Box plots of RNA-sequencing z-scores of p53 targets signature and reactome signatures in patients stratified by p53 dysfunction. (D) Violin plot of MDM2 gene expression in patients with MDS. (E) Box plots of RNA-sequencing z-scores of p53 targets signature in patients stratified by MDM2 expression and TP53 mutations. (F) FISH showing amplification of MDM2 gene on the long arm of chromosome 12 (12q15). Representative images of cells from MDM2 wild-type patient (upper panel) and cells from a patient with MDM2 gene amplification (CEP12 probe for the centromere of chromosome 12 was used as control). FISH, fluorescent in situ hybridization; MDS, myelodysplastic syndromes.
FIG 3.
FIG 3.
Characterization of the immunological bone marrow environment in MDS stratified according to p53 dysfunction. (A) Heat map of differentially expressed genes in patients stratified according to p53 dysfunction. (B) Functional enrichment analysis: the dot plot depicts the activity of reactome pathways from significant upregulated genes (on the left) or downregulated genes (on the right) in patients with versus without p53 dysfunction. (C) GSEA results of MYC targets gene signature (left) and HLA class II genes (right) in patients with versus without p53 dysfunction. (D) Upstream regulator analysis using Ingenuity Pathway Analysis. Volcano plot shows the significant activated and inhibited cytokines in patients with versus without p53 dysfunction. (E) Bar plot shows the variation of each immune cell type frequency in patients with versus without p53 dysfunction. The dashed line highlights the cell types with a significant variation (Bonferroni-corrected P value < .0001) with log(2) odds ratio >|0.2|, meaning an increase or reduction of at least 30% compared with patients with no p53 dysfunction. (F) Immunological effects of dysregulated cell types in patients with p53 dysfunction. FDR, false discovery rate; HLA, human leukocyte antigen; MDS, myelodysplastic syndromes; NES, normalized enrichment score.
FIG 4.
FIG 4.
Identification of a transcriptomic signature associated with p53 dysfunction. (A) Heat map of gene signature identified by the feature selection procedure. Patients are stratified by p53 dysfunction. Genes are annotated based on their specific pathways, and clusters summarizing these pathways are highlighted with different colors. (B-D) Overall survival of the Humanitas prospective MDS/AML cohort (N = 383), BeatAML cohort (N = 362), and TCGA AML cohort (N = 169) stratified by TP53 mutational status and transcriptomic signature associated with p53 dysfunction. MDS, myelodysplastic syndromes; OS, overall survival; TCGA, The Cancer Genome Atlas.
FIG 5.
FIG 5.
Single-cell multiomics longitudinal analysis of MDS with p53 dysfunction. (A) UMAP plot depicting the main cell types identified in a multiomics CITE-seq experiment, based on 27,290 cells. (B) Violin plot showing the p53 target signature score in CD34+ cells. (C) Violin plot showing HLA-DR protein expression on the surface of CD34+ tumor cells. (D) Violin plot showing PD-L1 protein expression on the surface of CD34+ tumor cells. (E, F) Violin plots showing HLA-DR and CD11a protein expression on the surface of monocytes. (G) Bubble plot depicting gene enrichment analysis of GO terms for downregulated genes associated with p53 dysfunction in the monocyte compartment. (H, I) Violin plots showing protein expression levels of activation markers CD28 and CD244 on CD8+ exhausted T cells. (J, K) Violin plots showing protein expression levels of the immunosuppressive enzyme CD39 and the immune checkpoint PD-1 on CD8+ exhausted T cells. (L) Violin plot showing protein expression levels of the inhibitory molecule PD-1 on Tregs at both disease onset and AML evolution. (M) Violin plot showing expression levels of the BACH2 in Tregs which suggest exposure to inflammation. (N) Gene set enrichment analysis of reactome IFN-related pathways in T- and NK-cell clusters. (O) Violin plot showing gene expression levels of the activation receptor NKG2D on NK cells. (P-R) Violin plots showing protein expression levels of the inhibitory molecules CD158, KLRG1, and Siglec-7 on NK cells in our cohort. Black dashed lines represent the median. Wilcoxon test, **<.01; ***<.001; ****<.0001. HLA, human leukocyte antigen; IFN, interferon; MDS, myelodysplastic syndromes; MHC, major histocompatibility complex; NES, normalized enrichment score.

Similar articles

References

    1. Kastenhuber ER, Lowe SW. Putting p53 in context. Cell. 2017;170:1062–1078. - PMC - PubMed
    1. Levine AJ, Oren M. The first 30 years of p53: Growing ever more complex. Nat Rev Cancer. 2009;9:749–758. - PMC - PubMed
    1. Vousden KH, Lane DP. p53 in health and disease. Nat Rev Mol Cell Biol. 2007;8:275–283. - PubMed
    1. Cazzola M, Della Porta MG, Malcovati L. The genetic basis of myelodysplasia and its clinical relevance. Blood. 2013;122:4021–4034. - PMC - PubMed
    1. Daver NG, Maiti A, Kadia TM, et al. TP53-mutated myelodysplastic syndrome and acute myeloid leukemia: Biology, current therapy, and future directions. Cancer Discov. 2022;12:2516–2529. - PMC - PubMed

Substances