. 2025 May 2;13(5):e010908.
doi: 10.1136/jitc-2024-010908.

B4GALT5 inhibits CD8+ T-cell response by downregulating MHC-I level through ERAD pathway in PDAC

Affiliations

B4GALT5 inhibits CD8+ T-cell response by downregulating MHC-I level through ERAD pathway in PDAC

Xin Xing et al. J Immunother Cancer. .

Abstract

Background: Immune evasion is a crucial event in the progression of pancreatic ductal adenocarcinoma (PDAC). The identification of new immunotherapeutic targets may provide a promising platform for advancing PDAC treatment. This study aims to investigate the role of beta-1,4-galactosyltransferase-5 (B4GALT5) in immune evasion by pancreatic cancer cells and evaluate its potential as an immunotherapeutic target.

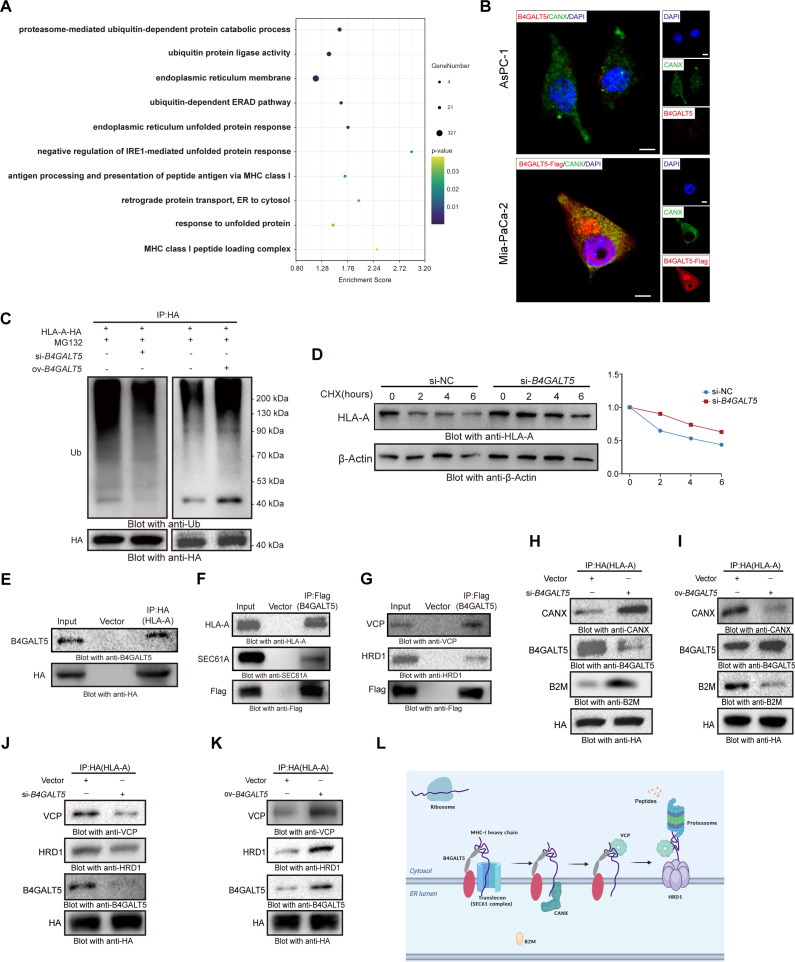
Methods: We conducted a comprehensive analysis using RNA sequencing data and tissue microarrays from patients with PDAC to investigate the association between B4GALT5 expression and patient prognosis. Using animal models, we further explored the impact of B4GALT5 on the quantity and activity of tumor-infiltrating CD8+ T cells. RNA sequencing and co-immunoprecipitation were used to explore the mechanism by which B4GALT5 regulates major histocompatibility complex (MHC-I) levels.

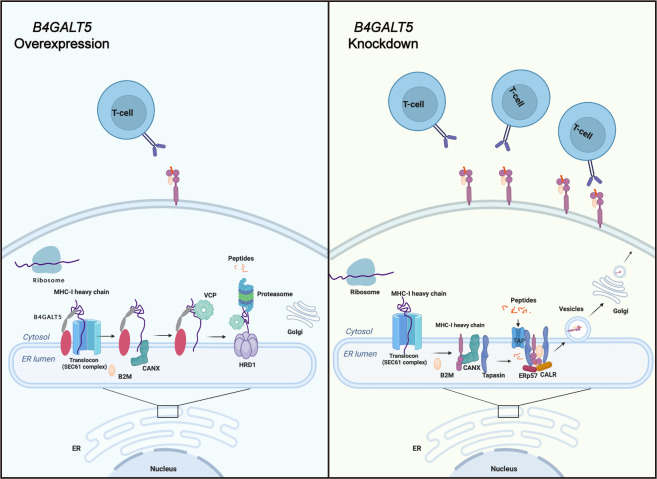
Results: Our study demonstrates that high expression of B4GALT5 in tumor cells is significantly associated with poor prognosis in patients with PDAC and reduced cytotoxic activity of tumor-infiltrating CD8+ T cells. Specifically, B4GALT5 suppresses MHC-I expression in tumor cells through the endoplasmic reticulum-associated degradation pathway, enabling them to evade immune surveillance by CD8+ T cells.

Conclusions: B4GALT5 impairs CD8+ T-cell recognition of tumor cells by regulating MHC-I levels, thereby promoting immune evasion. This makes B4GALT5 a highly promising immunotherapeutic target for improving the poor prognosis of patients with PDAC.

Keywords: Immunotherapy; Major histocompatibility complex - MHC; T cell; Tumor microenvironment - TME.


Conflict of interest statement

Competing interests: None declared.

Figures

Figure 1
Figure 1. B4GALT5 is highly expressed and predicts a poor prognosis in PDAC. (A) Differences in B4GALT5 mRNA expression between normal pancreatic tissues and tumor tissues in the TCGA and GTEx databases. (normal=171, tumor=143). (B–D) Differences in B4GALT5 mRNA expression between adjacent normal tissue and tumor tissue. GSE16515 (B, n=16 per group); GSE28735 (C, n=45 per group); Renji cohort (D, n=50 per group). (E) KM survival curves (log-rank test) comparing overall survival between high B4GALT5 expression samples (n=55) and low expression samples (n=88) in PDAC by using TCGA database. (F) Quantitative analysis of B4GALT5 mRNA expression in stromal cells, immune cells, and tumor cells in the GSE212461 single-cell RNA sequencing data set using log2 (TPM+1). (G) Left: representative immunohistochemical staining images showing differences in B4GALT5 expression from normal pancreas, through PanIN stages to PDAC (Scale bar: 50 µm). Right: correlation analysis of B4GALT5 expression with tumor size of patients with PDAC from Renji cohort (Fisher’s exact test). (H) Analysis of the relationship between B4GALT5 expression and patient prognosis based on immunohistochemical staining of patient with PDAC tissue microarrays from Renji Hospital, combined with clinical information using KM survival curves (log-rank test) (n=50 per group). (I) Representative immunohistochemical images showing differences in B4GALT5 expression between normal C57BL/6 mouse pancreas (NP) and KPC mouse pancreas (scale bar: 50 µm). B4GALT5, beta-1,4-galactosyltransferase-5; mRNA, messenger RNA; PDAC, pancreatic ductal adenocarcinoma; TCGA, The Cancer Genome Atla; KM, Kaplan-Meie; TPM, Transcript per million.
Figure 2
Figure 2. B4GALT5 promotes PDAC progression in vivo. (A–B) Verification of B4galt5 knockdown efficiency by quantitative PCR (A) and western blot (B) in KPC1199 and PANC02 cell lines. (C–D) Living Image system used to observe the progression of tumors in orthotopic PDAC mouse models using KPC1199 (C) and PANC02 (D) cells. n=5, per group. (E–F) Tumor size and weight on day 28 were analyzed. KPC1199 (E), PANC02 (F). (G–H) Immunofluorescence detection of Cleaved Caspase-3+ cells in the sh-NC and sh-B4galt5 groups of mouse PDAC models inoculated with the KPC1199 (G) and PANC02 cells (H), respectively. n=5, per group. Bars represent mean±SD. The p values presented, except for those in C and E, were calculated using an unpaired t-test. The p values for C and E were derived from a two-way analysis of variance. B4GALT5, beta-1,4-galactosyltransferase-5; PDAC, pancreatic ductal adenocarcinoma.
Figure 3
Figure 3. B4GALT5 suppresses the presentation of MHC-I molecules on PDAC cell membrane. (A) Flow cytometry analysis of H-2Kb levels on the surface of KPC1199 mouse PDAC cells in sh-NC and sh-B4galt5 groups. n=3 per group, three independent experiments. (B–C) Verification of knockdown and overexpression efficiency of B4GALT5 by quantitative PCR (B) and western blot (C) in AsPC-1 and PANC1. (D–E) Flow cytometry analysis of the alteration of the MHC-I level on the cell surface after B4GALT5 knockdown in AsPC-1 cells (D) and overexpression in PANC1 cells (E). (F–G) Western blot analysis of the alteration of total HLA-A, B, C protein levels after B4GALT5 knockdown in AsPC-1 cells (F) and overexpression in PANC1 cells (G). Bars represent mean±SD. The p values shown were calculated using an unpaired t-test. B4GALT5, beta-1,4-galactosyltransferase-5; MHC, major histocompatibility complex; PDAC, pancreatic ductal adenocarcinoma.
Figure 4
Figure 4. B4GALT5 regulates MHC-I via ERAD. (A) GO-BP enrichment analysis based on RNA sequencing data of AsPC-1 cells in si-NC and si-B4GALT5 groups. (B) Colocalization of B4GALT5 with CANX in AsPC-1 (up: endogenous B4GALT5 expression) and MIA-PaCa-2 (down: exogenous B4GALT5) cells. (C) After knocking down or overexpressing B4GALT5 in AsPC-1 cells stably expressing HLA-A-HA, cells were treated with MG132 (10 µM) for 8 hours, immunoprecipitated with the HA antibody and immunoblotted with the ubiquitin antibody. (D) In AsPC-1 cells, after knocking down B4GALT5 expression, cells were treated with cycloheximide (10 µM) for 0, 2, 4, or 6 hours, and the half-life of HLA-A was detected by western blotting. Right: quantitative estimates of class I HLA levels based on western blot analyses. (E–G) Co-IP detection of the interactions between B4GALT5 and HLA-A, SEC61A, VCP, and HRD1. (H–I) After knocking down B4GALT5 expression in AsPC-1 cells (H), and overexpressing B4GALT5 in MIA-PaCa-2 cells (I), the binding of HLA-A with CANX and B2M was detected by Co-IP. (J–K) After knocking down B4GALT5 expression in AsPC-1 cells (J), and overexpressing B4GALT5 in MIA-PaCa-2 cells (K), the binding of HLA-A with VCP and HRD1 was detected by Co-IP. (L) A model depicting the functional mechanism of B4GALT5 downregulating HLA-A via the ERAD pathway in pancreatic ductal adenocarcinoma. B4GALT5, beta-1,4-galactosyltransferase-5; GO-BP, gene ontology-biological process; CANX, calnexin; Co-IP, co-immunoprecipitation; ER, endoplasmic reticulum; ERAD, endoplasmic reticulum-associated degradation; MHC, major histocompatibility complex.
Figure 5
Figure 5. Beta-1,4-galactosyltransferase-5 inhibits the cytotoxicity of CD8+ T cells in vitro by suppressing major histocompatibility complex-I. (A–B) ELISA was used to detect the levels of GZMB, IFN-γ, and TNF-α in the supernatant of co-cultures of KPC1199-OVA (A) and PANC02-OVA (B) cells with OT-1 CD8+ T cells for 12 hours. n=3 per group. (C–D) OT-1 mouse CD8+ T cells were co-cultured with OVA-KPC1199 (C) or OVA-PANC02 (D) for 12 hours, and then flow cytometry was used to assess the levels of apoptosis of the tumor cells (CD8+ T cells: tumor cells=5:1; n=3 per group). Three independent experiments. (E–F) Different ratios of CD8+ T cells were co-cultured with KPC1199-OVA (E) or PANC02-OVA (F) (ratios: 5:1, 10:1, 15:1, 20:1) for 24 hours, and then CCK8 assay was used to assess tumor cell viabilities. n=3 per group, three independent experiments. (G–H) OT-1 mouse CD8+ T cells were co-cultured with KPC1199-OVA (G) or PANC02-OVA (H) and treated with αSIINFEKL antibody for 12 hours, followed by flow cytometry analysis to assess tumor cell apoptosis (CD8+ T cells: tumor cells=5:1; n=3 per group). Three independent experiments. Bars represent mean±SD. The p values shown were calculated using an unpaired t-test. GZMB, granzyme B; IFN, interferon; TNF, tumor necrosis factor.
Figure 6
Figure 6. B4GALT5 inhibits CD8+ T-cell infiltration in mouse models. (A) Left: representative immunohistochemistry staining results demonstrated significant differences in MHC-I staining in tumor tissues from tissue microarrays of patients with PDAC with high and low B4GALT5 expression. Scale bars: 100 µm (left); 50 µm (right). Right: HLA-A B C expression between patients with low and high expression levels of B4GALT5 was compared. Two-tailed t-test. (B) Multiplexed immunohistochemistry was used to detect the levels of CD8+ GZMB+ T cells (shown in white arrow) in tumor tissues of patients with PDAC with low B4GALT5 (up) and high B4GALT5 (down) expression. Scale bars: 100 µm (left); 50 µm (right). (C) Flow cytometry analysis of GZMB, TNF-α, and IFN-γ levels within tumor-infiltrating CD8+ T cells in tumor tissues from different groups (sh-NC, sh-B4galt5) with orthotopic PDAC models of KPC1199 mice (n=4 per group). (E–F) The Living Image system was used to observe tumor progression in an orthotopic PDAC mouse model constructed with KPC1199 cells after αH-2Kb blockade (E). Tumor size and weight were measured after αH-2Kb treatment (F). n=5, per group. (G–H) B4GALT5 expression across different cell types and treatment conditions of pancreatic cancer patients in the Gene Expression Omnibus data sets GSE202051 (G) and GSE156405 (H). Left: B4GALT5 expression across various cell types. Right: B4GALT5 expression of epithelial cells between the treatment and non-treatment groups. B4GALT5, beta-1,4-galactosyltransferase-5; IFN, interferon; MHC, major histocompatibility complex; PDAC, pancreatic ductal adenocarcinoma.
Figure 7
Figure 7. Inhibition of B4GALT5 restores surface MHC-I expression by preventing B4GALT5-mediated MHC-I degradation through the endoplasmic reticulum-associated degradation pathway, thereby promoting CD8+ T-cell infiltration and enhancing its antitumor effect against pancreatic ductal adenocarcinoma. B2M, beta-2 microglobulin; B4GALT5, beta-1,4-galactosyltransferase-5; CANX, calnexin; ER, endoplasmic reticulum; MHC, major histocompatibility complex.

References

    1. Mizrahi JD, Surana R, Valle JW, et al. Pancreatic cancer. Lancet. 2020;395:2008–20. doi: 10.1016/S0140-6736(20)30974-0. - DOI - PubMed
    1. Wood LD, Canto MI, Jaffee EM, et al. Pancreatic Cancer: Pathogenesis, Screening, Diagnosis, and Treatment. Gastroenterology. 2022;163:386–402. doi: 10.1053/j.gastro.2022.03.056. - DOI - PMC - PubMed
    1. Yamamoto K, Venida A, Yano J, et al. Autophagy promotes immune evasion of pancreatic cancer by degrading MHC-I. Nature New Biol. 2020;581:100–5. doi: 10.1038/s41586-020-2229-5. - DOI - PMC - PubMed
    1. Sang W, Zhou Y, Chen H, et al. Receptor-interacting Protein Kinase 2 Is an Immunotherapy Target in Pancreatic Cancer. Cancer Discov. 2024;14:326–47. doi: 10.1158/2159-8290.CD-23-0584. - DOI - PubMed
    1. Dersh D, Hollý J, Yewdell JW. A few good peptides: MHC class I-based cancer immunosurveillance and immunoevasion. Nat Rev Immunol. 2021;21:116–28. doi: 10.1038/s41577-020-0390-6. - DOI - PubMed

MeSH terms

Substances