

Laser treatment for urinary incontinence in elite female athletes analyzed using a discrete mathematics approach
- PMID: 40316601
- PMCID: PMC12048495
- DOI: 10.1038/s41598-025-00363-1
Laser treatment for urinary incontinence in elite female athletes analyzed using a discrete mathematics approach
Abstract
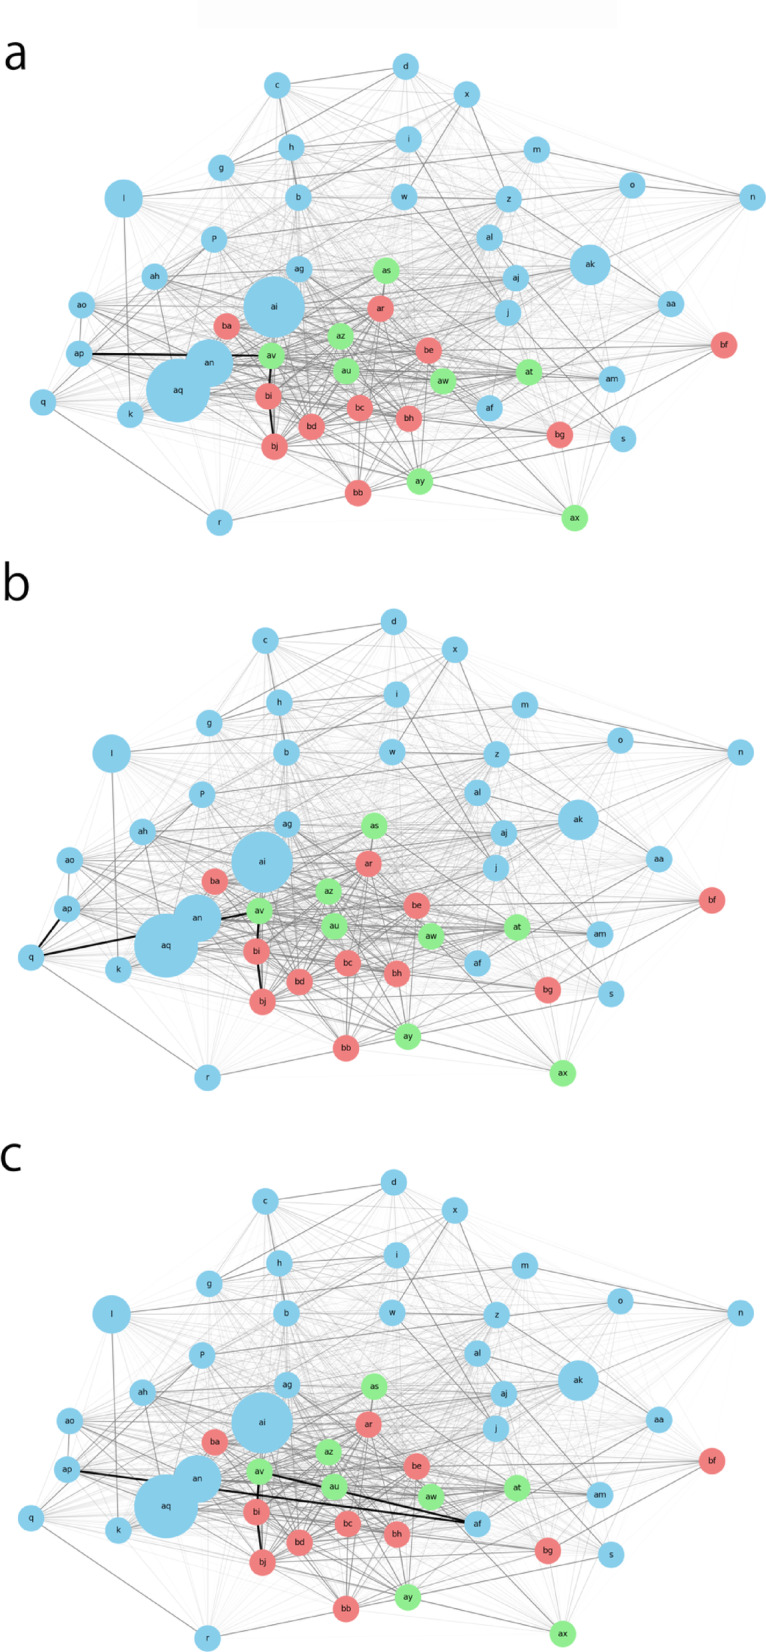
Efficient treatment strategies for stress urinary incontinence (SUI) in elite female athletes (EFAs) are crucial for their timely return to sports. This study evaluates the effectiveness and potential drawbacks of non-ablative Er: YAG laser therapy combined with pelvic floor muscle training (PFMT) in treating SUI among EFAs. We employ a discrete mathematics analytical approach using network graphs to identify key factors influencing treatment outcomes and to address the challenges of small sample sizes and unknown variables in this population. Our results demonstrate significant improvements in urinary incontinence symptoms and increased return rates to elite sports activities in the laser treatment group compared to the PFMT-only group. The discrete mathematics approach effectively visualizes the complex relationships between variables and supports the development of personalized treatment plans. This study highlights the potential of laser therapy as an effective treatment option for SUI in EFAs while emphasizing the importance of tailored treatment strategies.
Keywords: Discrete mathematics; Discrete mathematics analytical approach; Elite female athletes; Network graphs; Non-ablative Er:YAG laser therapy; Pelvic floor muscle training; Personalized medicine; Return to sports; Stress urinary incontinence; Treatment outcomes.
© 2025. The Author(s).
Conflict of interest statement
Declarations. Competing interests: The authors declare no competing interests.
Figures
Similar articles
-
Unsupervised clustering analysis of treatment strategies for elite female athletes with severe stress urinary incontinence: focusing on competition return and SUI improvement.Int Urol Nephrol. 2025 May;57(5):1493-1501. doi: 10.1007/s11255-024-04337-6. Epub 2024 Dec 29. Int Urol Nephrol. 2025. PMID: 39733386
-
Non-ablative Er:YAG laser therapy effect on stress urinary incontinence related to quality of life and sexual function: A randomized controlled trial.Eur J Obstet Gynecol Reprod Biol. 2018 May;224:153-158. doi: 10.1016/j.ejogrb.2018.03.038. Epub 2018 Mar 22. Eur J Obstet Gynecol Reprod Biol. 2018. PMID: 29604548 Clinical Trial.
-
Analysis of Predictive Factors for Return to Sports in Female Athletes With Stress Urinary Incontinence.Cureus. 2023 Aug 30;15(8):e44364. doi: 10.7759/cureus.44364. eCollection 2023 Aug. Cureus. 2023. PMID: 37664372 Free PMC article.
-
Urinary incontinence, pelvic floor dysfunction, exercise and sport.Sports Med. 2004;34(7):451-64. doi: 10.2165/00007256-200434070-00004. Sports Med. 2004. PMID: 15233598 Review.
-
Mechanisms for pelvic floor muscle training: Morphological changes and associations between changes in pelvic floor muscle variables and symptoms of female stress urinary incontinence and pelvic organ prolapse-A narrative review.Neurourol Urodyn. 2024 Nov;43(8):1977-1996. doi: 10.1002/nau.25551. Epub 2024 Jul 9. Neurourol Urodyn. 2024. PMID: 38979823 Review.
Cited by
-
Natural language processing reveals network structure of pain communication in social media using discrete mathematical analysis.Sci Rep. 2025 Aug 9;15(1):29219. doi: 10.1038/s41598-025-14680-y. Sci Rep. 2025. PMID: 40783425 Free PMC article.
References
-
- Trojano, M. et al. Treatment decisions in multiple sclerosis — insights from real-world observational studies. Nat. Rev. Neurol.13, 105–118 (2017). - PubMed
-
- Newgard, C. D. et al. Advanced statistics: the propensity Score—A method for estimating treatment effect in observational research. Acad. Emerg. Med.11, 953–961 (2004). - PubMed
-
- Staffa, S. J. & Zurakowski, D. Five steps to successfully implement and evaluate propensity score matching in clinical research studies. Anesth. Analg. 127, 1066–1073 (2018). - PubMed
MeSH terms
LinkOut - more resources
Full Text Sources
Medical
