

SARS-CoV-2 humoral immune responses in convalescent individuals over 12 months reveal severity-dependent antibody dynamics
- PMID: 40316665
- PMCID: PMC12048490
- DOI: 10.1038/s43856-025-00828-4
SARS-CoV-2 humoral immune responses in convalescent individuals over 12 months reveal severity-dependent antibody dynamics
Abstract
Background: Defining the kinetics of SARS-CoV-2 antibody responses is critical for informing the management of reinfections, vaccinations, and therapeutics of Coronavirus disease 2019 (COVID-19).
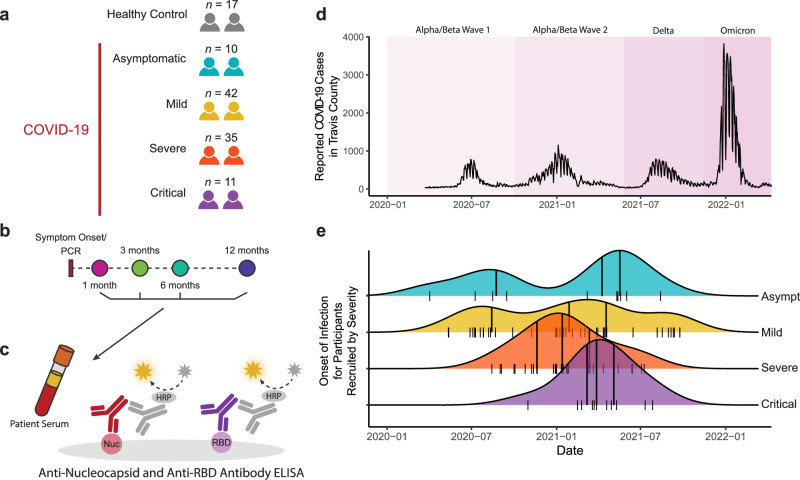
Methods: Using four antibody assays, we evaluated antibody titers against SARS-CoV-2 nucleocapsid (N), spike (S), and receptor binding domain (RBD) in 98 convalescent participants with varying COVID-19 disease severities (asymptomatic, mild, moderate or severe) at 1, 3, 6, and 12-months post-SARS-CoV-2-positive PCR and in 17 non-vaccinated, non-infected controls.
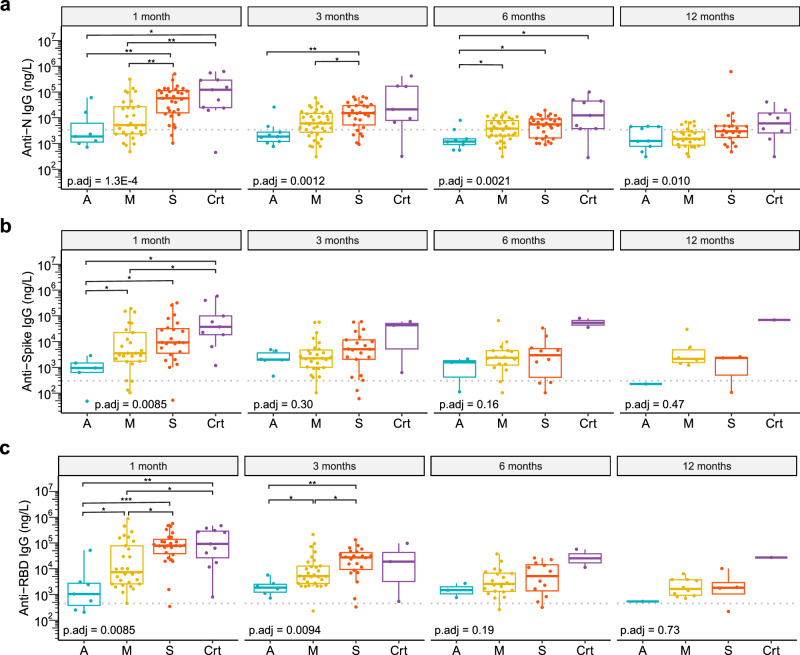
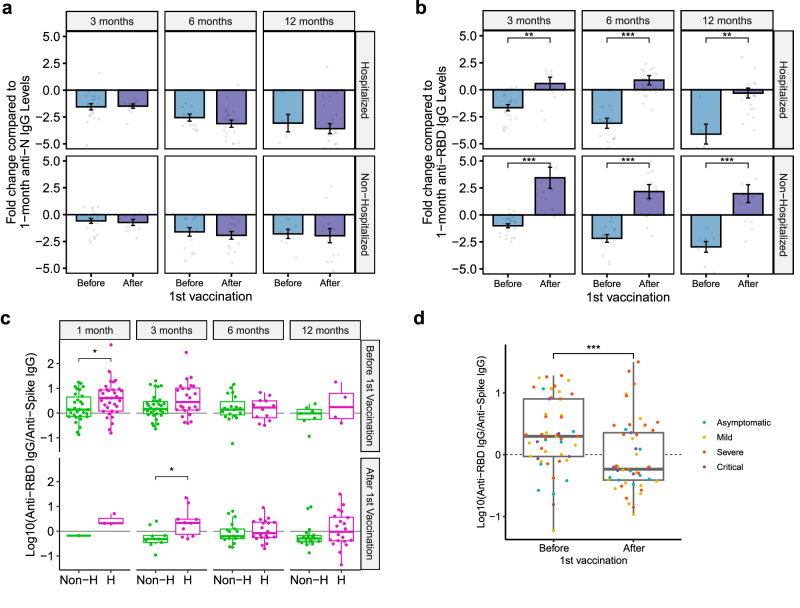
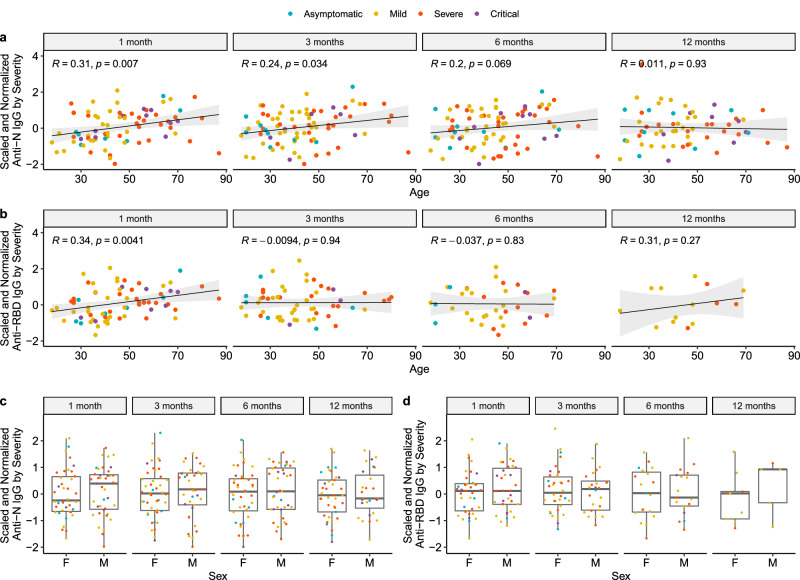
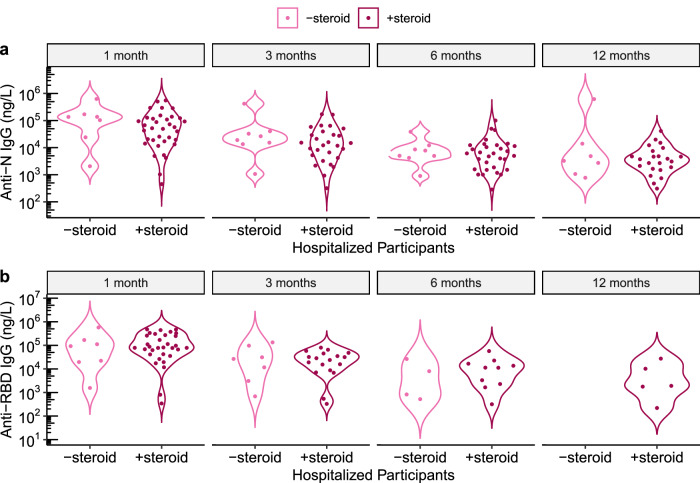
Results: Increasing acute COVID-19 disease severity correlates with higher anti-N and anti-RBD titers throughout 12 months post-infection. Anti-N and anti-RBD titers decline over time in all participants, except for increased anti-RBD titers post-vaccination, with hospitalized participants exhibiting faster decay rates. Less than 50% of participants retain anti-N titers above controls at 12 months, with non-hospitalized participants falling below controls sooner. Nearly all participants maintain anti-RBD titers above controls for 12 months, suggesting long-term protection against severe reinfections. Nonetheless, by 6 months, few participants retain >50% of their initial 1-month anti-N or anti-RBD titers. Notably, vaccine-induced anti-RBD titers are higher in non-hospitalized participants. Lastly, early convalescent titers correlate with age but not with Post-Acute Sequelae of SARS-CoV-2 infection (PASC) status or steroid use.
Conclusion: Hospitalized participants initially develop higher anti-SARS-CoV-2 antibody titers that decline faster relative to non-hospitalized participants. While anti-N titers fall below control levels in some participants, anti-RBD titers remain above controls over 12 months, demonstrating long-lived antibody responses known to protect against severe disease. These findings advance our understanding of COVID-19 antibody dynamics.
Plain language summary
This study explores how the immune system responds to COVID-19 over time by measuring antibodies, small proteins that help fight infection. We studied 98 participants who recovered from COVID-19 with varying illness severities and 17 who were never infected. Blood samples were collected over a year to track changes in antibody levels. Our results show that severe illness leads to higher antibody levels, though with a more precipitous antibody decline than in milder cases. Notably, antibodies that offer long-term protection against severe COVID-19 remain high for 12 months after the infection in most individuals. Lastly, vaccination boosts antibody levels, particularly in individuals with milder illness. Our research enhances understanding of immunity post COVID-19 and informs vaccination and reinfection prevention strategies.
© 2025. The Author(s).
Conflict of interest statement
Competing interests: The authors declare the following competing interests: Nadia Siles Alvarado: Recipient of National Consortium for Graduate Degrees for Minorities in Engineering and Science (GEM) Fellowship. Cole Maguire: Recipient of NIDA T32 Training Grant 5T32DA018926-18 for graduate student stipend and travel support for scientific conferences from the European Committee for Treatment and Research in Multiple Sclerosis. Sam Bazzi: Recipient of NIH NIAAA T32AA007471 and Fred Murphy Jones & Homer Lindsey Bruce Endowed Fellowships for graduate student stipend. Christopher DiPasquale: Vice President of Assay Development of Babson Diagnostics, Inc.; holder of stock/stock options for Babson; salary as employee of Babson. Eric Olson: Chairman of the Board of Babson Diagnostics, Inc.; holder of stock/stock options for Babson; salary as employee of Babson. Justin F. Rousseau: Recipient of NIH National Institute of Allergy and Infectious Diseases (NIAID) funding for another project. Stephen M. Strakowski: Recipient of NIH National Institute of Mental Health and Jassen funding for other projects and consulting fees for Sunovion, WebMD, and Meadows Mental Health Policy Institute; holds leadership role with American Brain Coalition and National Network Depression Centers. Jennifer Maynard: Recipient of grant funding from Welch Foundation, Texas Biologics, NIAID, and National Science Foundation; consulting fees from Sidley on behalf of Amgen and Genentech; and travel support for attending PEGS Protein & Antibody Engineering Summit 2023, Gordon conference on Protein Engineering 2023, and MD Anderson & UT Austin Collaborative Research Summit 2023; license holder for HexaPro (multiple non-exclusive licenses) and 3A3 antibody, specific for prefusion spike; and member of scientific advisory boards of Janux (2019–present) and Releviate (2020-present). Lauren I. R. Ehrlich: Recipient of grant funding from NIAID, NIA, CPRIT, APH, and Advanced Micro Devices; travel support for attending scientific conferences from the NIH and UT Austin. Esther Melamed: Recipient of grant funding from NIAAA, Austin Public Health, Babson Diagnostics; consulting fees from Horizon, Roche, Summus; honoraria from the National Center for Health Research and American Academy of Physical Medicine and Rehabilitation; and travel support for scientific conferences from the NIH, National Center for Health Research, and American Academy of Physical Medicine and Rehabilitation. All remaining authors have no competing interests: Maisey Schuler, Dzifa Amengor, Annalee Nguyen, Rebecca Wilen, Jacob Rogers, Blaine Caslin, Melissa Abigania, Todd Triplett, Janelle Creaturo, Kerin Hurley, and Dennis Wylie.
Figures

Update of
-
SARS-CoV-2 Humoral Immune Responses in Convalescent Individuals Over 12 Months Reveal Severity-Dependent Antibody Dynamics.medRxiv [Preprint]. 2023 Dec 7:2023.12.05.23299462. doi: 10.1101/2023.12.05.23299462. medRxiv. 2023. Update in: Commun Med (Lond). 2025 May 2;5(1):149. doi: 10.1038/s43856-025-00828-4. PMID: 38106077 Free PMC article. Updated. Preprint.
References
-
- World Health Organization. WHO Coronavirus (COVID-19) Dashboard [Internet]. WHO Health Emergency Dashboard. 2023 [cited 2023 Jan 3]. https://covid19.who.int/
-
- CDC. COVID Data Tracker: COVID-19 Vaccinations in the United States [Internet]. Centers for Disease Control and Prevention. 2020 [cited 2023 Jun 27]. https://covid.cdc.gov/covid-data-tracker/#vaccination-states-jurisdictions
Grants and funding
- R01 AI104870/AI/NIAID NIH HHS/United States
- NIAAA K08 T26-1616-11/U.S. Department of Health & Human Services | NIH | National Institute on Alcohol Abuse and Alcoholism (NIAAA)
- R01AI104870/Division of Intramural Research, National Institute of Allergy and Infectious Diseases (Division of Intramural Research of the NIAID)
LinkOut - more resources
Full Text Sources
Miscellaneous
