. 2025 May 2;8(1):690.
doi: 10.1038/s42003-025-08066-z.

CD55 upregulation in T cells of COVID-19 patients suppresses type-I interferon responses

Affiliations

CD55 upregulation in T cells of COVID-19 patients suppresses type-I interferon responses

Maria G Detsika et al. Commun Biol. .

Abstract

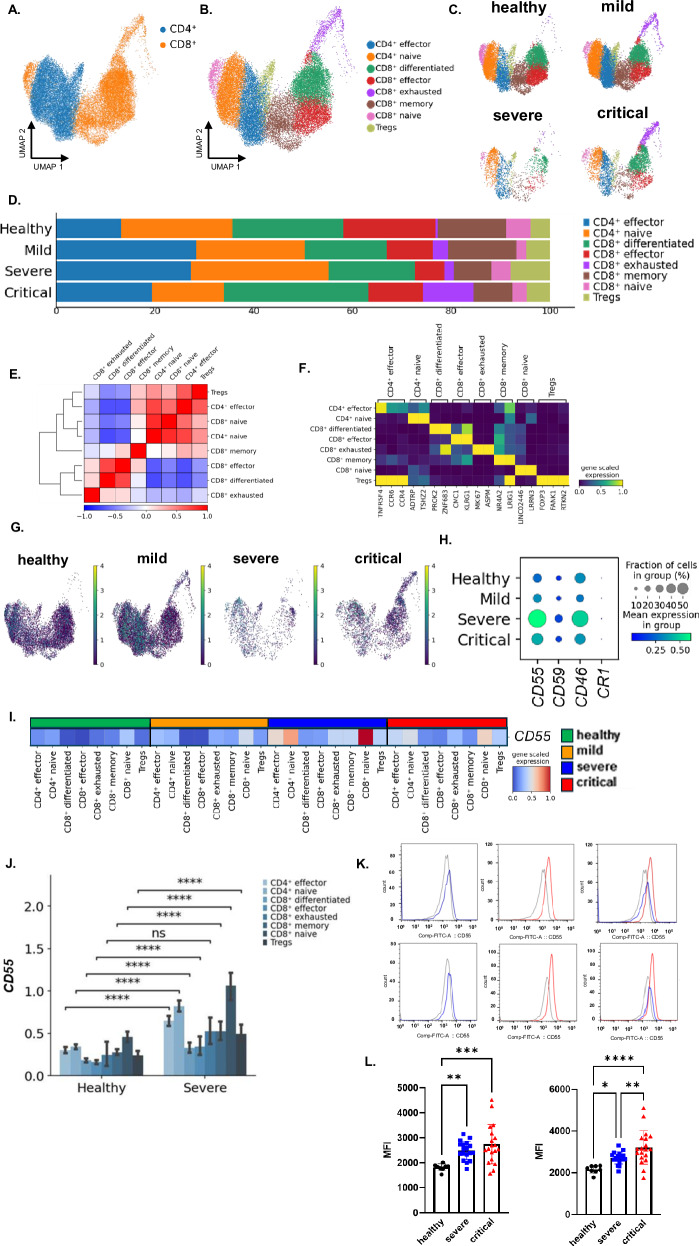
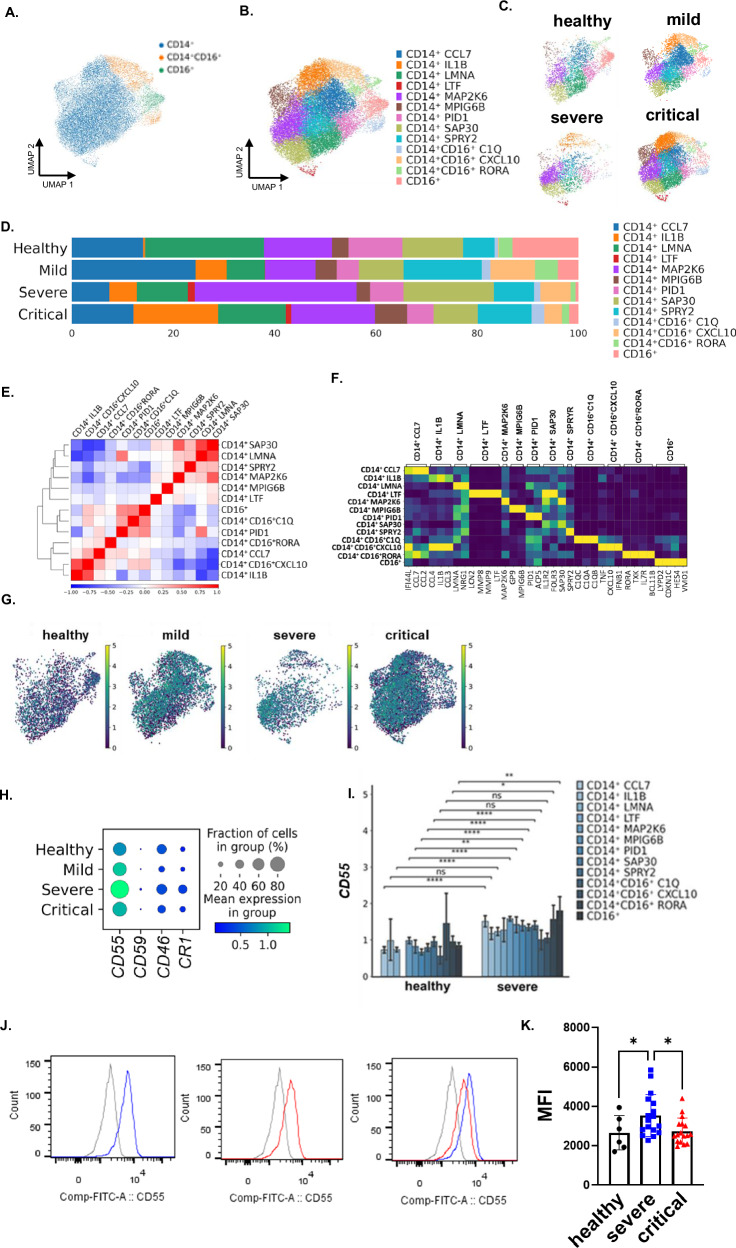
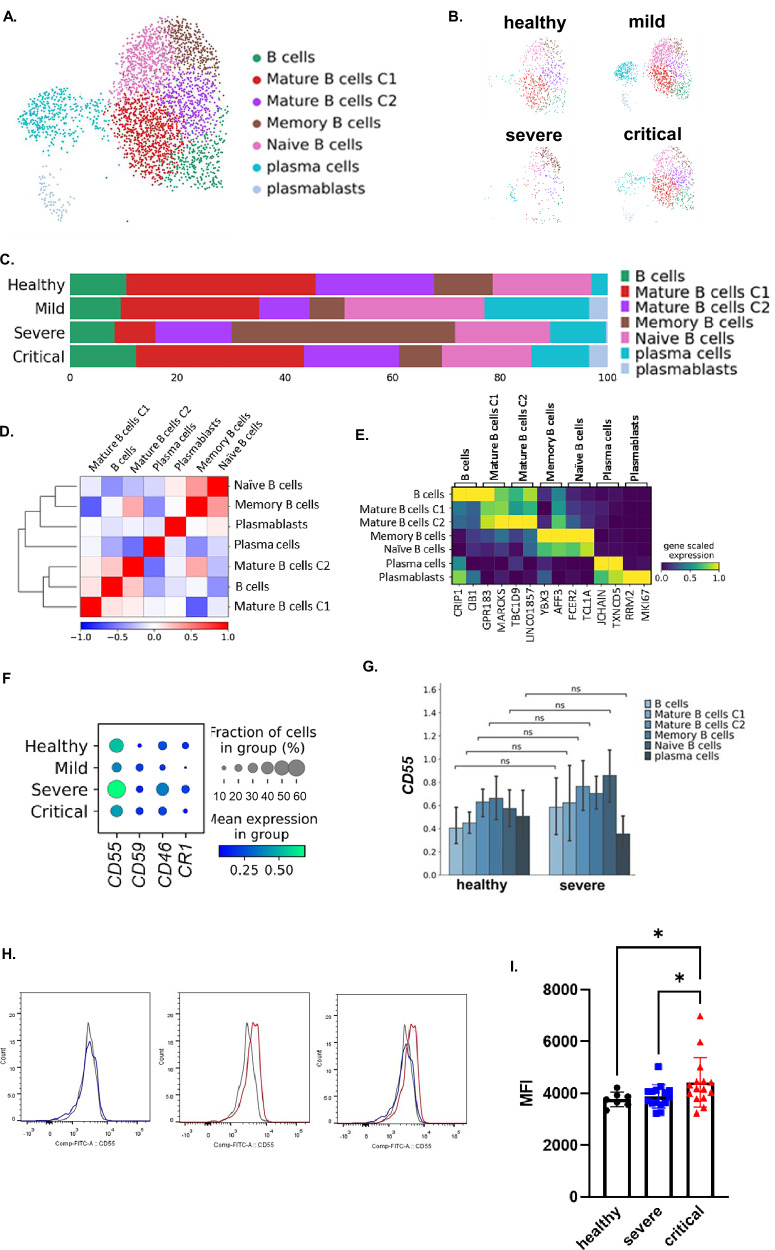
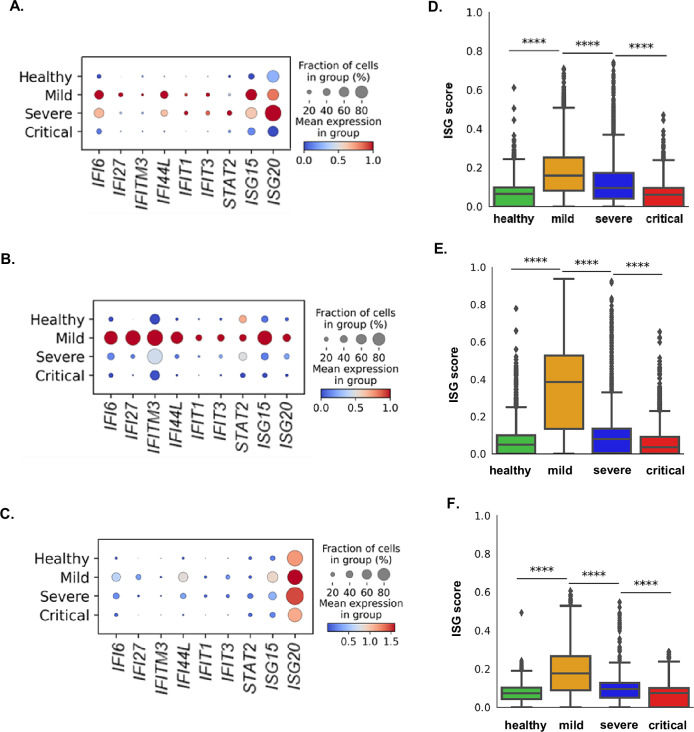
Complement overactivation, has been verified in COVID-19 patients. Complement regulatory proteins, including CD55, control complement overactivation thus eliminating complement deposition and cell lysis. We investigated complement regulatory protein expression in COVID-19 for potential deregulated expression patterns driving disease pathogenesis. Single-cell RNA-seq revealed increased PBMCs CD55 expression in severely and critically ill patients. This increase was also detected upon integrated subclustering analysis of monocyte, T cell and B cell populations. FACS analysis confirmed the significant upregulation of CD55 expression in CD4+ and CD8+ T cells and monocyte populations of severely and critically ill COVID-19 patients. This upregulation was associated with decreased expression of type-I IFN-stimulated genes (ISGs) in patients with severe and critical COVID-19, indicating a suppressor effect of CD55. Silencing of CD55 in T cells from COVID-19 severely ill patients in vitro and sensitization with SARS-CoV-2 peptides resulted in significantly augmented expression of ISGs and a reversal of their expression to levels similar to control or higher. The present study uncovers, to the best of our knowledge, a novel regulatory effect of CD55 on type-I IFN responses of severely ill COVID-19 patients, thus indicating its contribution to COVID-19 pathogenesis, and identifies a novel mechanistic pathway in the COVID-19 immune response.


Conflict of interest statement

Competing interests: All authors declare no competing interests.

Figures

Fig. 1
Fig. 1. Complement regulatory proteins expression in PBMCs isolated from COVID-19 patients and healthy donors.
A Schematic representation of the experimental design for single cell RNA sequencing (scRNA-seq) analysis of PBMCs isolated from blood samples of donors with mild (n = 4), severe (n = 4), critical (n = 4) COVID-19 and healthy donors (n = 4). Study validation cohorts include 80 additional donors (n = 40 for flow cytometric analysis, n = 40 for Real-time PCR amplification) and six additional donors for the functional experiments (n = 3 for patient samples and n = 3 for healthy controls). B Major immune cell subsets were identified and visualised in 2D by UMAP. C UMAP representation of isolated PBMCs from healthy, mild, severe, and critical COVID-19 patients. D Stacked Bar charts showing the relative abundances (%) of cell clusters across disease states as indicated. E Expression levels of CD55, CD46, CD59 and CR1 in COVID-19 patients and controls. Mean expression bar plots, with error bars representing the 95% bootstrapped confidence intervals around the mean. Statistical analysis performed by the Wilcoxon rank sum test ****p < 0.0001, numbers next to asterisks indicate log fold changes. F Dot plot representing CD55 expression in healthy and COVID-19 patients of different states; the dot size represents the fraction of cells in the clusters, mean expression is colour coded as indicated. G Bar plots showing relative CD55 mRNA levels in whole blood samples isolated from severely and critically ill COVID-19 patients compared to healthy controls (mean ± SD). **p < 0.01, ***p < 0.001. Statistical analysis was performed by Kruskal–Wallis non-parametric test for more than two groups comparisons. Fisher’s least significant difference test was used for post-hoc analysis. H Receiver operating curve analysis for prediction of ICU admission by CD55 mRNA expression levels.
Fig. 2
Fig. 2. Compositional changes and CD55 expression in T cells subpopulations of COVID-19 patients.
A UMAP representation of 31,763 Τ cells coloured by cell type and B cluster assignment. C UMAP representation of all the T cells analysed across different disease states as indicated (healthy group: 11,180 cells, mild disease group: 13,687 cells, severe disease group: 2470 cells and critical disease group: 4426 cells). D Stacked bar plot representing T cell cluster quantitative changes (%) in each disease state as indicated, E Pearson correlation plot of scaled expression values followed by hierarchical clustering, for the most variable genes identified in the T cell subpopulations integrated. Colour spectrum represents positive correlations in red, to no correlation in white, to negative correlation in blue. F scRNA-seq heatmap showing the average scaled expression for selected marker genes of each subpopulation; mean expression is colour coded as indicated. G Feature plots showing CD55 gene expression in the T cell subpopulation UMAP space. H Dot plot depicting expression levels of CD55 in all T cell clusters across disease state; the dot size represents the fraction of cells in the clusters, mean expression is colour coded as indicated. I Matrix plot depicting differential expression of CD55 across the different T cell subpopulations depending on the disease state; mean CD55 expression levels and disease states, are colour coded, as indicated. J CD55 expression levels in each T cell cluster, in healthy and severe donors as indicated. Mean expression bar plots, with error bars representing the 95% bootstrapped confidence intervals around the mean. Statistical analysis performed by the Wilcoxon rank sum test *p < 0.05, **p < 0.01, ****p < 0.0001. K Side-by-side plots of flow cytometry histograms showing CD55 expression in CD4+ (top panel) and CD8+ T (lower panel) cell populations; severe disease patient sample (blue histogram), critical disease patient sample (red histogram) and healthy control sample (grey histogram). L Bar plots depicting quantitation of CD55 protein expression levels in CD4+ and CD8+ T cells determined by flow cytometric analysis in severe (n = 20) and critical (n = 20) COVID-19 patient cohorts (mean ± SD); Statistical analysis was performed by one-way ANOVA testing for more than two groups comparisons. Post-hoc analysis was performed by Fisher’s least significant difference test. *p < 0.05, **p < 0.01, ***p < 0.001, ****p < 0.0001.
Fig. 3
Fig. 3. Compositional changes and CD55 expression in monocytes subpopulation.
A UMAP representation of 19,303 monocytes coloured by cell type and B cluster assignment, as indicated on the figure. C UMAP representation of all the monocytes analysed across different disease states as indicated (healthy group: 3060 cells, mild disease group: 5750 cells, severe disease group: 2289 cells and critical disease group: 8204 cells). D Stacked bar plot representing monocyte cluster quantitative changes (%) in each disease state as indicated. E Pearson correlation plot of scaled expression values followed by hierarchical clustering, for the most variable genes identified in the monocytes subpopulations integrated. Colour spectrum represents positive correlations in red, to no correlation in white, to negative correlation in blue. F scRNA-seq heatmap showing the average scaled expression for selected marker genes of each subpopulation; mean expression is colour coded as indicated. G Feature plots showing CD55 gene expression in the monocytes subpopulation UMAP space. H Dot plot depicting expression levels of CD55 in all monocytes clusters across disease state; the dot size represents the fraction of cells in the clusters, mean expression is colour coded as indicated. I CD55 expression levels in each monocyte cluster, in healthy and severe donors as indicated. Mean expression bar plots, with error bars representing the 95% bootstrapped confidence intervals around the mean. Statistical analysis performed by the Wilcoxon rank sum test *p < 0.05, **p < 0.01, ****p < 0.0001. J Side-by-side plots of flow cytometry histograms showing CD55 expression in monocytes; severe disease patient sample (blue histogram), critical disease patient sample (red histogram) and healthy control sample (grey histogram). K Bar plots depicting quantitation of CD55 protein expression levels in monocytes determined by flow cytometric analysis in severe (n = 20) and critical (n = 20) COVID-19 patient cohorts (mean ± SD); Statistical analysis was performed by one-way ANOVA testing for more than two groups comparisons. Post-hoc analysis was performed by Fisher’s least significant difference test. *p < 0.05, **p < 0.01, ***p < 0.001, ****p < 0.0001.
Fig. 4
Fig. 4. Compositional changes and CD55 expression in B cells subpopulation of COVID-19 patients.
A UMAP representation of 3,038 B cells coloured by cluster assignment, as indicated. B UMAP representation of all the B cells analysed across different disease states, as indicated (healthy group: 617 cells, mild disease group: 1328 cells, severe disease group: 289 cells and critical disease group: 804 cells). C Stacked bar plot representing B cell clusters quantitative changes (%) in each disease state as indicated. D Pearson correlation plot of scaled expression values followed by hierarchical clustering, for the most variable genes identified in the B cells subpopulations integrated. Colour spectrum represents positive correlations in red, to no correlation in white, to negative correlation in blue. E scRNA-seq heatmap showing the average scaled expression for selected marker genes of each subpopulation; mean expression is colour coded as indicated. F Dot plot depicting expression levels of CD55 in all B cell clusters across disease state; the dot size represents the fraction of cells in the clusters, mean expression is colour coded as indicated. G CD55 expression levels in each B cell cluster, in healthy and severe donors as indicated. Mean expression bar plots, with error bars representing the 95% bootstrapped confidence intervals around the mean. Statistical analysis performed by the Wilcoxon rank sum test; ns=non-significant. H Side-by-side plots of flow cytometry histograms showing CD55 expression in B cells; severe disease patient sample (blue histogram), critical disease patient sample (red histogram) and healthy control sample (grey histogram). I Bar plots depicting quantitation of CD55 protein expression levels in B cells determined by flow cytometric analysis in severe (n = 20) and critical (n = 20) COVID-19 patient cohorts (mean ± SD); Statistical analysis was performed by one-way ANOVA testing for more than two groups comparisons. Post-hoc analysis was performed by Fisher’s least significant difference test. *p < 0.05, **p < 0.01, ***p < 0.001, ****p < 0.0001.
Fig. 5
Fig. 5. Impaired type-I interferon responses in severely and critically ill COVID-19 patients.
Bar plots representing quantitative analysis produced by gene set enrichment analysis (GSEA) performed using gene lists derived by comparison of critical versus mild COVID-19 in: A CD4+ effector T cell cluster, B CD8+ effector T cell cluster, C classical monocyte CD14+IL1B cluster, D non-classical CD16+ cluster, E mature B cells cluster and F naive B cell cluster; FDR ≤ 0.05. G Dot plot depicting expression levels of ISGs, in the total PBMC population, across disease state; the dot size represents the fraction of cells in the clusters, mean expression is colour coded as indicated. H Feature plots representing ISGs expression on the UMAP space in each disease state analysed.
Fig. 6
Fig. 6. Impaired type-I interferon response genes (ISGs) expression in T cells, monocytes and B cells of severely and critically ill COVID-19 patients.
Dot plot depicting expression levels of ISGs in the: A T cell subpopulation, B monocyte subpopulation, and C B cell subpopulation, across disease state. The dot size represents the fraction of cells in the clusters, mean expression is colour coded as indicated. D ISG score changes in COVID-19 patients of different disease severity and healthy controls in the T cell subpopulation, E monocyte subpopulation and F the B cell subpopulation. Mean expression box plots, with error bars representing the 95% bootstrapped confidence intervals around the mean. Statistical analysis performed by the Mann–Whitney–Wilcoxon test two sided with Bonferroni correction ****p < 0.0001.
Fig. 7
Fig. 7. Reduced CD55 expression enhances type-I interferon-stimulated gene responsiveness in PBMCs from COVID-19 patients following sensitisation of T cells.
PBMCs isolated from patients with severe COVID-19 (n = 3) and control individuals (n = 3) were transfected with siRNA for CD55 and subsequently sensitised with SARS-CoV-2 peptide pools. Following incubations, relative mRNA levels were assessed by Real-time PCR amplification for IFI6, IFI27, IFI44L, IFIT3, ISG15 and STAT2 as indicated. Relative ISG expression is shown versus (A) patient control (mock-transfected PBMCs from COVID-19 patients) and (B) healthy control (mock-transfected PBMCs from healthy individuals). The bars represent mean values ± SEM as calculated. Statistical analysis was performed with One-way ANOVA. Post hoc analysis was performed by Fisher’s least significant difference test. *p < 0.05; **p < 0.01; ***p < 0.001; ****p < 0.0001.

References

    1. de Nooijer, A. H. et al. Complement activation in the disease course of coronavirus disease 2019 and its effects on clinical outcomes. J. Infect. Dis.223, 214–224 (2021). - PMC - PubMed
    1. Alosaimi, B. et al. Complement anaphylatoxins and inflammatory cytokines as prognostic markers for COVID-19 severity and in-hospital mortality. Front. Immunol.12, 668725 (2021). - PMC - PubMed
    1. Detsika M. G. et al. C3a and C5b-9 differentially predict COVID-19 progression and outcome. Life12, 1335 (2022). - PMC - PubMed
    1. Magro, C. et al. Complement associated microvascular injury and thrombosis in the pathogenesis of severe COVID-19 infection: a report of five cases. Transl. Res. J. Lab. Clin. Med.220, 1–13 (2020). - PMC - PubMed
    1. Ge, X. et al. Complement and complement regulatory proteins are upregulated in lungs of COVID-19 patients. Pathol. Res. Pract.247, 154519 (2023). - PMC - PubMed