

scCompass: An Integrated Multi-Species scRNA-seq Database for AI-Ready
- PMID: 40317650
- PMCID: PMC12224968
- DOI: 10.1002/advs.202500870
scCompass: An Integrated Multi-Species scRNA-seq Database for AI-Ready
Abstract
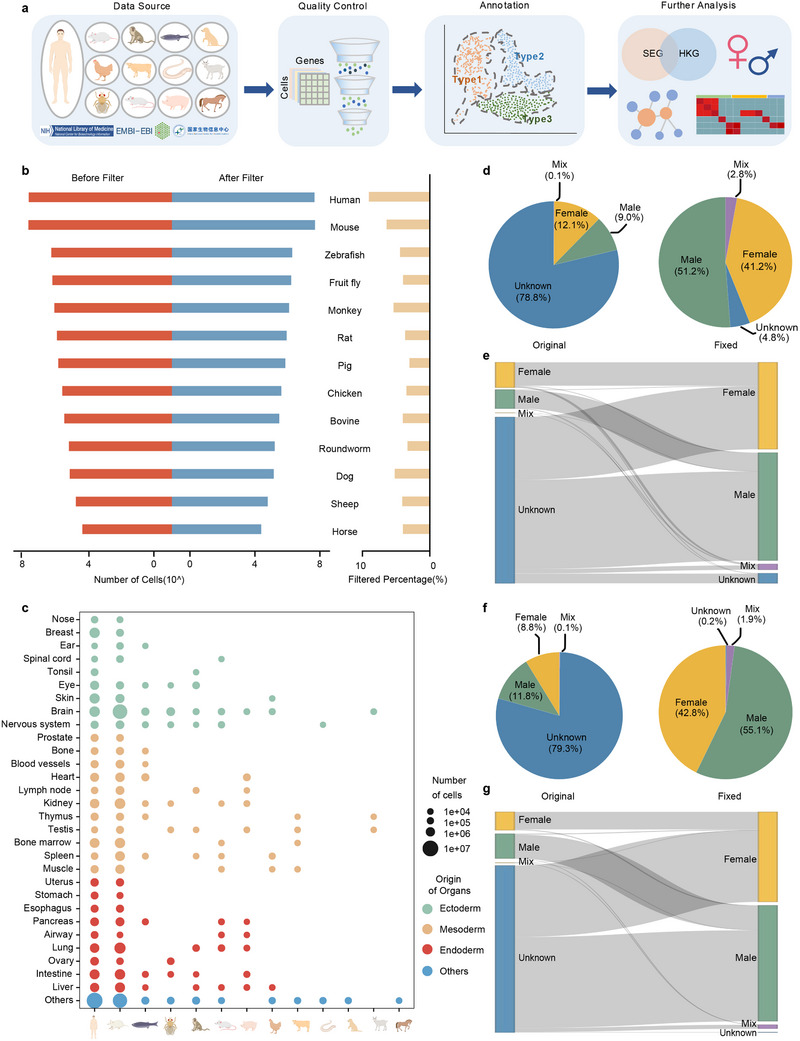
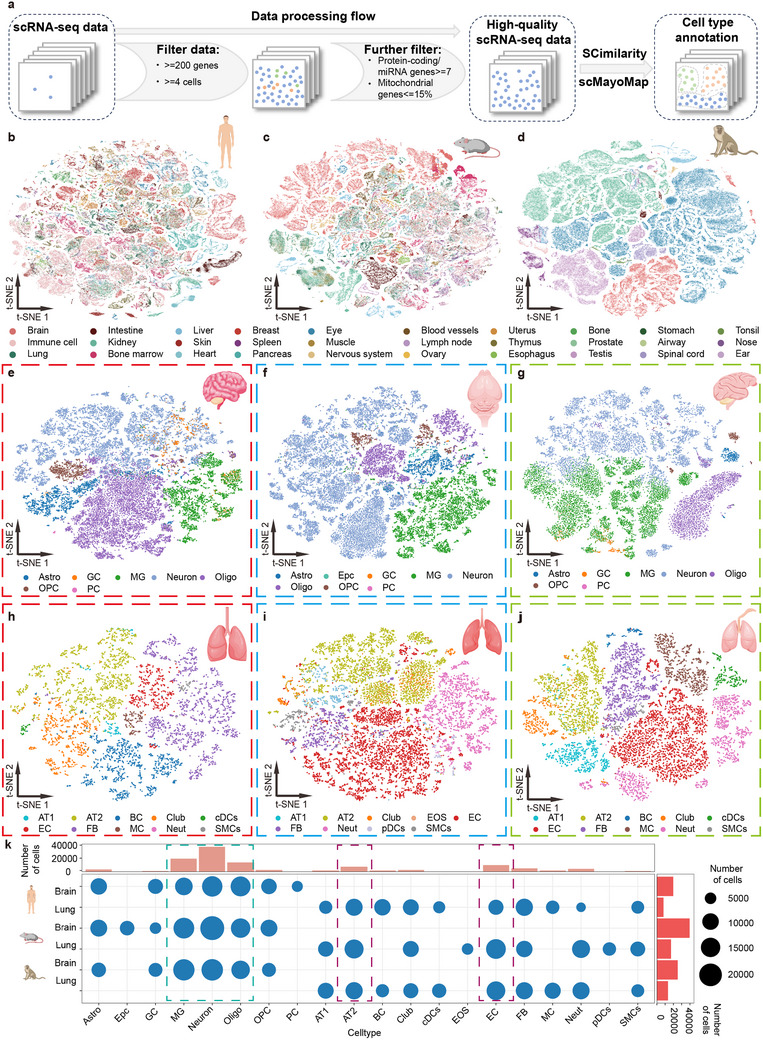
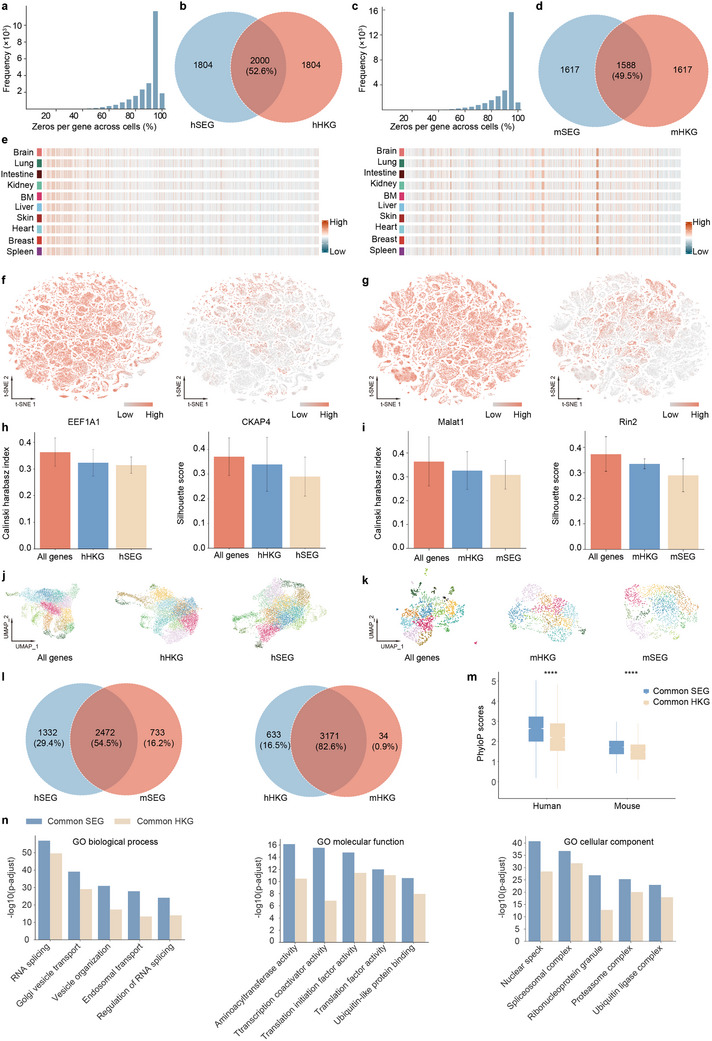
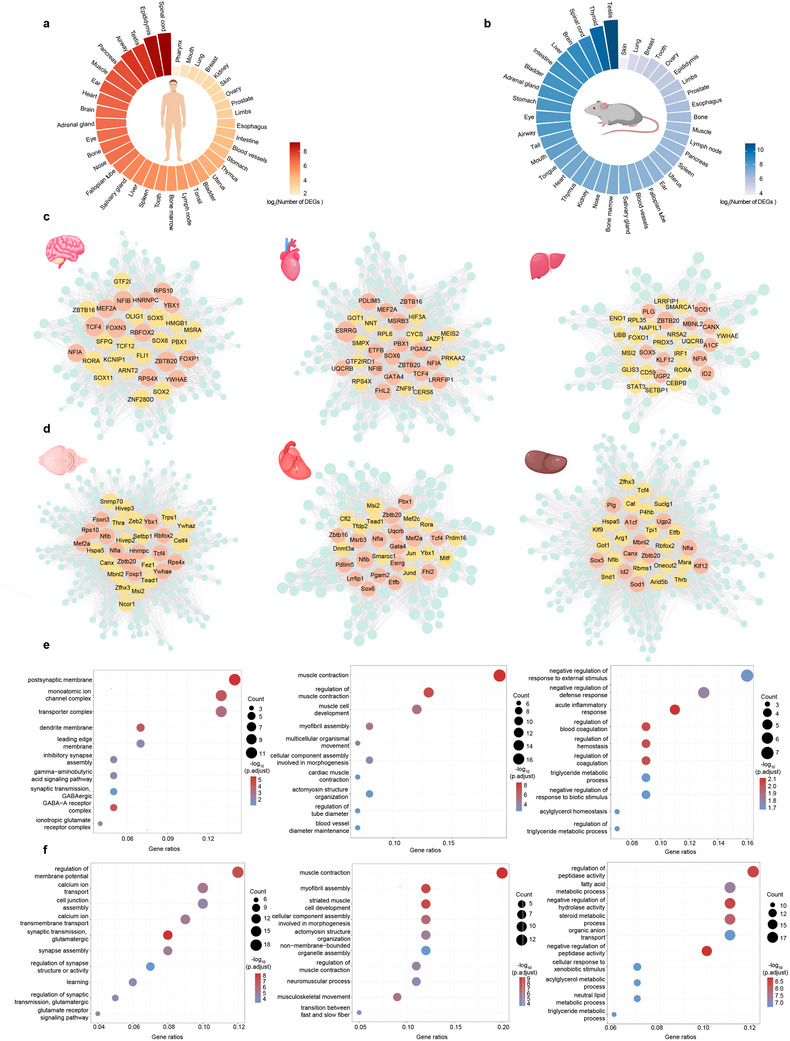
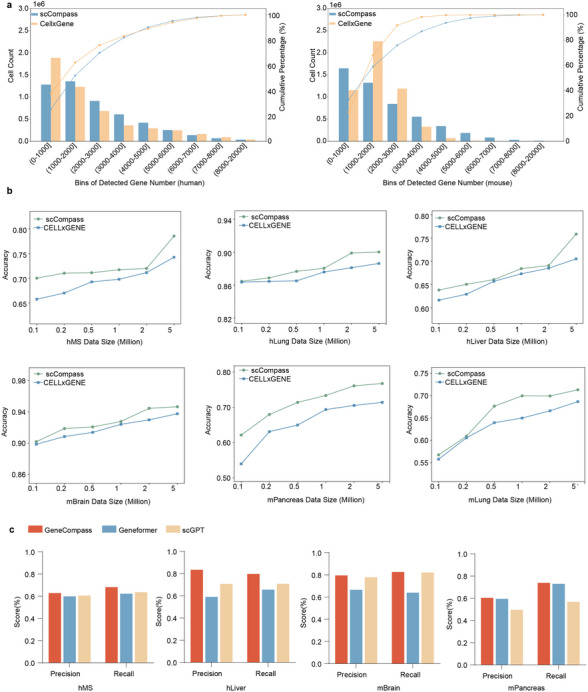
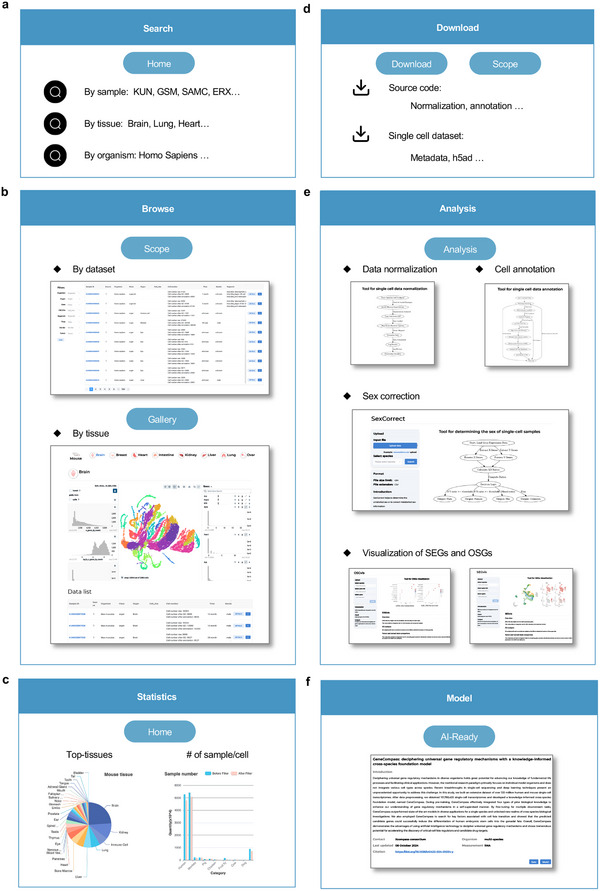
Emerging single-cell sequencing technology has generated large amounts of data, allowing analysis of cellular dynamics and gene regulation at the single-cell resolution. Advances in artificial intelligence enhance life sciences research by delivering critical insights and optimizing data analysis processes. However, inconsistent data processing quality and standards remain to be a major challenge. Here scCompass is proposed, which provides a comprehensive resource designed to build large-scale, multi-species, and model-friendly single-cell data collection. By applying standardized data pre-processing, scCompass integrates and curates transcriptomic data from nearly 105 million single cells across 13 species. Using this extensive dataset, it is able to identify stable expression genes (SEGs) and organ-specific expression genes (OSGs) in humans and mice. Different scalable datasets are provided that can be easily adapted for AI model training and the pretrained checkpoints with state-of-the-art single-cell foundation models. In summary, scCompass is highly efficient and scalable database for AI-ready, which combined with user-friendly data sharing, visualization, and online analysis, greatly simplifies data access and exploitation for researchers in single-cell biology (http://www.bdbe.cn/kun).
Keywords: AI‐ready; multi‐species; scRNA‐seq database; single‐cell.
© 2025 The Author(s). Advanced Science published by Wiley‐VCH GmbH.
Conflict of interest statement
The authors declare no conflict of interest.
Figures
Similar articles
-
ScInfeR: an efficient method for annotating cell types and sub-types in single-cell RNA-seq, ATAC-seq, and spatial omics.Brief Bioinform. 2025 May 1;26(3):bbaf253. doi: 10.1093/bib/bbaf253. Brief Bioinform. 2025. PMID: 40471991 Free PMC article.
-
A rapid and systematic review of the clinical effectiveness and cost-effectiveness of paclitaxel, docetaxel, gemcitabine and vinorelbine in non-small-cell lung cancer.Health Technol Assess. 2001;5(32):1-195. doi: 10.3310/hta5320. Health Technol Assess. 2001. PMID: 12065068
-
The human infertility single-cell testis atlas (HISTA): an interactive molecular scRNA-Seq reference of the human testis.Andrology. 2025 Jul;13(5):1190-1200. doi: 10.1111/andr.13637. Epub 2024 Apr 5. Andrology. 2025. PMID: 38577799
-
Ensemble machine learning-based pre-trained annotation approach for scRNA-seq data using gradient boosting with genetic optimizer.BMC Bioinformatics. 2025 Jul 1;26(1):166. doi: 10.1186/s12859-025-06151-y. BMC Bioinformatics. 2025. PMID: 40596854 Free PMC article.
-
Signs and symptoms to determine if a patient presenting in primary care or hospital outpatient settings has COVID-19.Cochrane Database Syst Rev. 2022 May 20;5(5):CD013665. doi: 10.1002/14651858.CD013665.pub3. Cochrane Database Syst Rev. 2022. PMID: 35593186 Free PMC article.
Cited by
-
Soft graph clustering for single-cell RNA sequencing data.BMC Bioinformatics. 2025 Jul 25;26(1):195. doi: 10.1186/s12859-025-06231-z. BMC Bioinformatics. 2025. PMID: 40713495 Free PMC article.
References
-
- Sun F., Li H., Sun D., Fu S., Gu L., Shao X., Wang Q., Dong X., Duan B., Xing F., Wu J., Xiao M., Zhao F., Han J. J., Liu Q., Fan X., Li C., Wang C., Shi T., Science China Life Sciences 2024, 1, 68. - PubMed
-
- Beumer J., Clevers H., Nat. Rev. Mol. Cell Biol. 2021, 22, 39. - PubMed
-
- Qiu C., Martin B. K., Welsh I. C., Daza R. M., Le T.‐M., Huang X., Nichols E. K., Taylor M. L., Fulton O., O'Day D. R., Gomes A. R., Ilcisin S., Srivatsan S., Deng X., Disteche C. M., Noble W. S., Hamazaki N., Moens C. B., Kimelman D., Cao J., Schier A. F., Spielmann M., Murray S. A., Trapnell C., Shendure J., Nature 2024, 626, 1084. - PMC - PubMed
MeSH terms
Grants and funding
- 92470204/National Natural Science Foundation of China
- 2024YFF0729201/National Key Research and Development Program of China
- 2024YFF0729200/National Key Research and Development Program of China
- XDA0460305toG.F./Strategic Priority Research Program of the Chinese Academy of Sciences
- YSBR-076/CAS Project for Young Scientists in Basic Research
LinkOut - more resources
Full Text Sources