. 2025 May 27;44(5):115636.
doi: 10.1016/j.celrep.2025.115636. Epub 2025 May 1.

Increased burden of rare risk variants across gene expression networks predisposes to sporadic Parkinson's disease

Affiliations

Increased burden of rare risk variants across gene expression networks predisposes to sporadic Parkinson's disease

Elena Eubanks et al. Cell Rep. .

Abstract

Alpha-synuclein (αSyn) is an intrinsically disordered protein that accumulates in the brains of patients with Parkinson's disease (PD). Through a high-throughput screen, we recently identified 38 genes whose knockdown modulates αSyn propagation. Here, we show that, among those, TAX1BP1 regulates how αSyn interacts with lipids, and ADAMTS19 modulates how αSyn phase separates into inclusions, adding to the growing body of evidence implicating those processes in PD. Through RNA sequencing, we identify several genes that are differentially expressed after knockdown of TAX1BP1 or ADAMTS19 and carry an increased frequency of rare risk variants in patients with PD versus healthy controls. Those differentially expressed genes cluster within modules in regions of the brain that develop high degrees of αSyn pathology. We propose a model for the genetic architecture of sporadic PD: increased burden of risk variants across genetic networks dysregulates pathways underlying αSyn homeostasis and leads to pathology and neurodegeneration.

Keywords: CP: Neuroscience; Lewy bodies; Parkinson’s disease; alpha-synuclein; chloroquine; genomics; lipid droplets; lipids; liquid-liquid phase separation; transcriptomics.


Conflict of interest statement

Declaration of interests M.M.M. is an inventor of filed and issued patents related to α-synuclein. M.M.M. is a founder of MentiNova, Inc. E.K. is a member of the EMBO Scientific Exchange Grants Advisory Board.

Figures

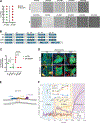
Figure 1.
Figure 1.. Effect of TAX1BP1 or ADAMTS19 knockdown on αSyn inclusions
(A) Diagram showing the regions within the αSyn protein: N-terminal domain, non-Aβ component (NAC), C-terminal acidic tail. (B) Diagram showing the location of the mutations in the 3K αSyn mutant protein. The E46K is a naturally occurring Mendelian mutation, whereas the E35K and E61K are artificial mutations in the flanking repeat motifs. (C) Workflow of the experiments undertaken on the 3K αSyn cell line. (D and E) (D) Effect of knockdown of TAX1BP1 and ADAMTS19 versus scrambled (SCR) on the number and (E) size of αSyn inclusions over several days. One-way ANOVA with Dunnett test correction for multiple testing. Data are represented as mean ± standard deviation (SD). (F) Representative confocal images for (D and E). Scale bar, 20 μm. *p ≤ 0.05, **p ≤ 0.01, ***p ≤ 0.001, ****p ≤ 0.0001. See also Figure S1 and Table S1.
Figure 2.
Figure 2.. The role of LLPS in the formation of αSyn inclusions
(A) Fluorescence recovery after photobleaching (FRAP) plots on the inclusions formed in the 3K αSyn M17D cell line. Shown in the plot is the immobile fraction (Fi), which represents the proportion of fluorescence that did not recover, as indicated by the plateau level reached. 130 inclusions were bleached in whole and 16 partially. Unpaired two-tailed t test. (B) Confocal images showing the appearance of one αSyn inclusion before bleaching, right after bleaching and post recovery (plateau phase). Scale bar, 2 μm. (C) Recovery plot for a representative FRAP experiment. (D) Timecourse FRAP experiment showing the evolution of the Fi over 120 h. The 16 h time point was compared to each subsequent time point through a one-way ANOVA with Dunnett test correction for multiple testing. Time points 48–120 h were analyzed through a one-way ANOVA with test for linear trend. (E) Proposed sequence of changes in the liquid-solid status of αSyn inclusions over time. (F and G) (F) Number and (G) size of αSyn inclusions per cell after treatment with various concentrations of 1,6-hexanediol (%v/v). One-way ANOVA with test for linear trend. (H) Representative confocal images for (J). Scale bar, 5 μm. (I) FRAP on αSyn inclusions after knockdown of TAX1BP1 and ADAMTS19 versus non-targeting SCR control (2 days post transfection). One-sample t tests followed by Bonferroni correction for multiple tests. (J) Distribution of the sizes of the inclusions that were analyzed for each siRNA. This was done to ensure that matched populations of inclusions were imaged for each condition, given that we have observed a change in Fi depending on the size of the inclusions (see Figure S2A). Data are represented as mean ± SD. *p ≤ 0.05, **p ≤ 0.01, ***p ≤ 0.001, ****p ≤ 0.0001. UT, untreated; Fi, immobile fraction; MFI, mean fluorescence intensity. (F and G) Data were normalized to the negative control within each independent experiment, which was arbitrarily assigned the value of 1. See also Figure S2.
Figure 3.
Figure 3.. LDs, membranes, and vesicles integrate within αSyn inclusions
(A) Representative confocal images showing αSyn inclusions before and after treatment with 600 μM oleic acid (OA). Cells were stained with LipidTOX deep red stain for neutral lipids. Scale bar, 5 μm. (B) Fraction of the overlapping surface areas of the red (LipidTOX) and green (αSyn) masks relatively to the total surface area of the red mask. One-way ANOVA with test for linear trend. (C) Fraction of the overlapping surface areas of the green (αSyn) and red (LipidTOX) masks relatively to the total surface area of the green mask. One-way ANOVA with test for linear trend. (D) Cryoelectron tomography (cryo-ET) of cell lysates prepared from 3K M17D cells show an LD and fragmented membrane pieces meshed within amorphous αSyn aggregates. (i) Correlative light microscopy and low-magnification electron microscopy (EM) image of a representative αSyn punctum. Scale bar, 2 μm. (ii) Slice view of a tomogram of the αSyn punctum in (i). Scale bar, 200 nm. (iii) Isosurface view of the tomogram. Scale bar, 200 nm. (iv) Zoom-in slice view of an LD and surrounding αSyn densities and membrane fragments as in orange box in (ii). Scale bar, 100 nm. (v) 3D isosurface view of the LD in (iv). Scale bar, 100 nm. (vi) Isosurface view of upper left boxed in region from (iii), rotated 180° showing αSyn on the surface of membrane fragments and vesicles. Scale bar, 50 nm. (vii) Isosurface view of lower right boxed in region from (iii), rotated 45° showing αSyn densities on membranes with significant deformation. Scale bar, 50 nm. Blue, membrane; pink, αSyn aggregate; orange, LD; purple, ribosomes. (E) Representative confocal images showing the effect of TAX1BP1 or ADAMTS19 knockdown on the LDs entrapped in αSyn inclusions. Scale bar, 10 μm. (F–H) Normalized proportion of Swiss cheese inclusions (F), solid inclusions (G), and hollow inclusions (H) after knocking down TAX1BP1 or ADAMTS19, versus SCR control, in the presence or absence of OA treatment. Data were analyzed through one-sample t tests followed by Bonferroni correction for multiple tests. Eight biological replicates. (I) Number of lipid units (including single and clustered LDs) per cell after knocking down TAX1BP1 or ADAMTS19 versus SCR control in the presence and absence of endogenous αSyn. Data were normalized to the SCR siRNA, which was designated arbitrarily as 1. Samples in the presence and absence of endogenous αSyn were analyzed separately through a one-way ANOVA with Dunnett test correction for multiple testing. (J) Representative confocal images showing the effect of TAX1BP1 or ADAMTS19 knockdown on the LDs in the presence or absence of αSyn protein. Scale bar, 10 μm. Data are represented as mean ± SD. *p ≤ 0.05, **p ≤ 0.01, ***p ≤ 0.001, ****p ≤ 0.0001. SA, surface area; LDs, lipid droplets; DOX, doxycycline. See also Figure S3. (F–H) The data were normalized to the untreated sample for each siRNA, which was designated arbitrarily as 1.
Figure 4.
Figure 4.. The propensity of 3K αSyn to phase separate and interact with lipids
(A) LLPS diagram for αSyn and representative images. Scale bar, 10 μm. (B) Diagrams of the amino acid sequence of αSyn showing the wild-type (WT) version and the artificial mutants studied. Blue rectangles, repeat motifs; red, glutamic acid to lysine substitutions; yellow, valine to glutamic acid substitutions. (C) Number of αSyn inclusions per cell for the three artificial mutants: 3K, KKTK, 3KVE. Data were normalized to the 3K sample without OA treatment, which was arbitrarily designated as 1. Data were analyzed through a one-way ANOVA with Dunnett test correction for multiple testing, separately for the OA-treated and untreated conditions. Only statistically significant differences are indicated on the plot. (D) Representative confocal images of the 3K, 3KVE, and KKTK αSyn mutants, with and without OA treatment. Scale bar, 5 μm. (E) Side view of coarse-grained representation of the WT αSyn in the Martini model. Different regions of the protein including the N helix (residues 1–33), U link (residues 34–44), C helix (residues 45–92), and the C terminus (residues 93–140) are shown in blue, orange, yellow, and purple, respectively. The head groups of POPG lipids are shown in gray. (F) The average distance of each residue to the nearest lipid during the 6-μs-long simulation. Blue triangle markers correspond to the mutated residues 35, 46, and 61, and green markers indicate the mutated residues 37, 48, and 63, both with respect to the WT alpha-synuclein. The inset shows the relative depth dr of the mutated residues and the centers of mass of the N and C helices with respect to the lipid bilayer’s top surface for each mutant. Data are represented as mean ± SD. *p ≤ 0.05, **p ≤ 0.01, ***p ≤ 0.001, ****p ≤ 0.0001. See also Figure S4 and Table S2.
Figure 5.
Figure 5.. Mitochondrial bioenergetics are impacted by TAX1BP1 or ADAMTS19 knockdown
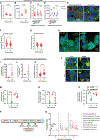
(A) Plot showing the MFI of tetramethylrhodamine methyl ester (TMRM) after knockdown of TAX1BP1 or ADAMTS19, versus SCR control. Carbonyl cyanide m-chlorophenyl hydrazone (CCCP) was used as a positive control. z stacks were acquired, and the maximum-intensity projection images are shown. Data were analyzed through a one-way ANOVA with Dunnett test correction for multiple testing; only the SCR, ADAMTS19, and TAX1BP1 samples were included. (B) Representative confocal images for (A). Scale bar, 5 μm. (C) FRET of the ATP FRET reporter used to quantify the amount of intracellular ATP. Data were analyzed through a one-way ANOVA with Dunnett test correction for multiple testing. (D) Representative confocal images of the ATP FRET reporter and FRET channel from (C). Ratiometric image of FRET channel normalized to cyan fluorescent protein (CFP) channel is also shown. Scale bar, 10 μm. Data are represented as mean ± SD. *p ≤ 0.05, **p ≤ 0.01, ***p ≤ 0.001, ****p ≤ 0.0001. TMRM, tetramethylrhodamine methyl ester; A.U., arbitrary units. See also Figure S5.
Figure 6.
Figure 6.. Effect of chloroquine treatment on αSyn inclusions
(A and B) (A) Cells were treated with 50 μM chloroquine for 2 h at 48 h after doxycycline induction and the number of αSyn inclusions per cell (B) and the lysosomal surface area were quantified. Unpaired two-tailed t tests. (C and D) (C) Number of αSyn inclusions per cell (D) and lysosomal surface area with and without treatment with 50 μM chloroquine at 48 h after doxycycline induction and siRNA knockdown of ADAMTS19 and TAX1BP1. Unpaired two-tailed t tests. (E) Representative confocal images for (A) and (B). Scale bar, 20 μm. (F and G) (F) Effect of 2 h and (G) 5 h chloroquine treatment at 48 h after doxycycline induction on the immobile fraction of αSyn inclusions, as determined by FRAP experiments. Unpaired two-tailed t test. (H) Representative confocal images showing αSyn inclusions that formed 16 h after simultaneous doxycycline induction and chloroquine treatment. Scale bar, 5 μm. (I and J) (I) Quantification of (H) showing that chloroquine-treated cells showed a larger number of αSyn inclusions per cell, (J) but there was no difference in the average size of the inclusions. One-sample t tests. (K) FRAP measurements showed that chloroquine treatment significantly increased the immobile fraction of the inclusions. (L) Representative confocal images of 3K cells after 16 h of 600 μM OA treatment and 5 h of 50 μM chloroquine treatment. All four combinations of treatment statuses were tested. Scale bar, 5 μm. (M–O) (M) Plot showing the total number of αSyn inclusions per cell, (N) the number of solid αSyn inclusions per cell, and (O) the number of Swiss-cheese αSyn inclusions per cell after 5 h of chloroquine treatment in comparison to the untreated condition and in the presence or absence of pre-treatment with 600 μM OA. Samples that were and were not pre-treated with OA were normalized separately to the non-chloroquine-treated condition, which was arbitrarily designated as 1. One-sample t tests. (P) Diagram showing the workflow of the chloroquine experiment in cultured cells that were transfected with the GFP-2A-αSyn-RFP or the GFP-2A-RFP constructs to monitor αSyn propagation. Cells were seeded in cover-glass-bottom chamber slides on day 1. (Q) Propagation ratio of αSyn-RFP and RFP alone. Data were normalized to the GFP-2A-RFP negative control at day 6, which was arbitrarily designated as 1. Six biological replicates. Two-way ANOVA with Tukey’s correction. Data are represented as mean ± SD. *p ≤ 0.05, **p ≤ 0.01, ***p ≤ 0.001, ****p ≤ 0.0001. CQ, chloroquine; UT, untreated. (I) and (J) were analyzed through one-sample t tests and (K) by unpaired two-tailed t test. See also Figure S6.
Figure 7.
Figure 7.. TAX1BP1 genetic networks
(A) Gene expression networks in which DEGs, as determined through RNA sequencing after TAX1BP1 knockdown, cluster more significantly than expected by random chance. Blue module in the caudate. (B) Black module in the putamen. (C) Light cyan module in the cerebral hemisphere. (D) Brown module in the frontal cortex. See also Figure S7 and Tables S1 and S3–S7.

Update of

References

    1. Jao CC, Hegde BG, Chen J, Haworth IS, and Langen R (2008). Structure of membrane-bound alpha-synuclein from site-directed spin labeling and computational refinement. Proc. Natl. Acad. Sci. USA 105, 19666–19671. 10.1073/pnas.0807826105. - DOI - PMC - PubMed
    1. Tsigelny IF, Sharikov Y, Wrasidlo W, Gonzalez T, Desplats PA, Crews L, Spencer B, and Masliah E (2012). Role of alpha-synuclein penetration into the membrane in the mechanisms of oligomer pore formation. FEBS J. 279, 1000–1013. 10.1111/j.1742-4658.2012.08489.x. - DOI - PMC - PubMed
    1. Wietek J, Haralampiev I, Amoussouvi A, Herrmann A, and Stöckl M (2013). Membrane bound alpha-synuclein is fully embedded in the lipid bilayer while segments with higher flexibility remain. FEBS Lett. 587, 2572–2577. 10.1016/j.febslet.2013.06.034. - DOI - PubMed
    1. Kim TE, Newman AJ, Imberdis T, Brontesi L, Tripathi A, Ramalingam N, Fanning S, Selkoe D, and Dettmer U (2021). Excess membrane binding of monomeric alpha-beta- and gamma-synuclein is invariably associated with inclusion formation and toxicity. Hum. Mol. Genet. 30, 2332–2346. 10.1093/hmg/ddab188. - DOI - PMC - PubMed
    1. Shahmoradian SH, Lewis AJ, Genoud C, Hench J, Moors TE, Navarro PP, Castaño-Díez D, Schweighauser G, Graff-Meyer A, Goldie KN, et al. (2019). Lewy pathology in Parkinson’s disease consists of crowded organelles and lipid membranes. Nat. Neurosci. 22, 1099–1109. 10.1038/s41593-019-0423-2. - DOI - PubMed

LinkOut - more resources